Last updated:
The ROI of CRO is the incremental revenue generated by a conversion rate improvement divided by the total cost of the optimisation work, expressed as a percentage.
Most founders do not run this calculation before deciding whether CRO is worth investing in. They think about the improvement percentage instead. That is the wrong frame. A 20% lift in conversion rate means nothing without the revenue formula behind it. Twenty percent of what traffic? Over what time period? Against what cost of work? Run the actual numbers and you get a specific figure. That figure is almost always larger than expected.
The calculation has four steps. All the inputs are available right now: your current traffic, your current conversion rate, your average order value, a conservative estimate of what a well-executed programme will produce, and the cost of the engagement. Most people who run it for the first time are surprised. Small improvements at meaningful traffic volumes produce outsized revenue effects. And unlike paid acquisition, the return does not reset each month. It compounds.
If you want grounding in what CRO involves before working through the numbers, our article on what conversion rate optimisation is covers the discipline from the beginning.
What is the CRO ROI formula and how does it work
The formula has three components: revenue now, revenue at the improved rate, and the cost of the work. The difference between the first two is your incremental revenue. Divide that by the cost and multiply by 100. That is your ROI percentage. Here is each step with worked numbers.
Step 1: your current monthly revenue from the channel being optimised
Take your monthly traffic to the relevant page or funnel step. Multiply by your current conversion rate. Multiply by your average order value. That is your current monthly revenue from that traffic.
Example
50,000 monthly visitors to the product page
Current conversion rate: 1.8%
Average order value: $95
Current monthly revenue = 50,000 × 0.018 × $95 = $85,500
Step 2: projected revenue at the improved rate
Apply the improved conversion rate to the same traffic and average order value. Use a conservative estimate: a 15 to 20% relative improvement is achievable from a well-executed programme. A 50% improvement is possible, but it should not be your planning assumption.
Example
50,000 monthly visitors
Improved conversion rate: 2.1% (a 16.7% relative improvement from 1.8%)
Average order value: $95
Projected monthly revenue = 50,000 × 0.021 × $95 = $99,750
Step 3: incremental monthly revenue
Subtract current monthly revenue from projected monthly revenue. That is the incremental monthly revenue the programme is expected to produce.
Example
$99,750 minus $85,500 = $14,250 incremental monthly revenue
Step 4: ROI
Divide the total incremental revenue over the engagement period by the total cost of the work. Express as a percentage.
Example
Three-month engagement at $4,500 total cost
Incremental monthly revenue: $14,250
Total incremental revenue over three months: $42,750
ROI = ($42,750 / $4,500) × 100 = 850%
For every dollar spent, the business generates $8.50 in incremental revenue.
Run this calculation before you commit to anything. Use your actual traffic, your actual conversion rate, and your actual average order value. Set the improvement estimate at 15% relative. If the result is positive over a 12-month horizon at that conservative estimate, the investment is justified. If it only works at 30% or 40%, the risk is higher than it looks.
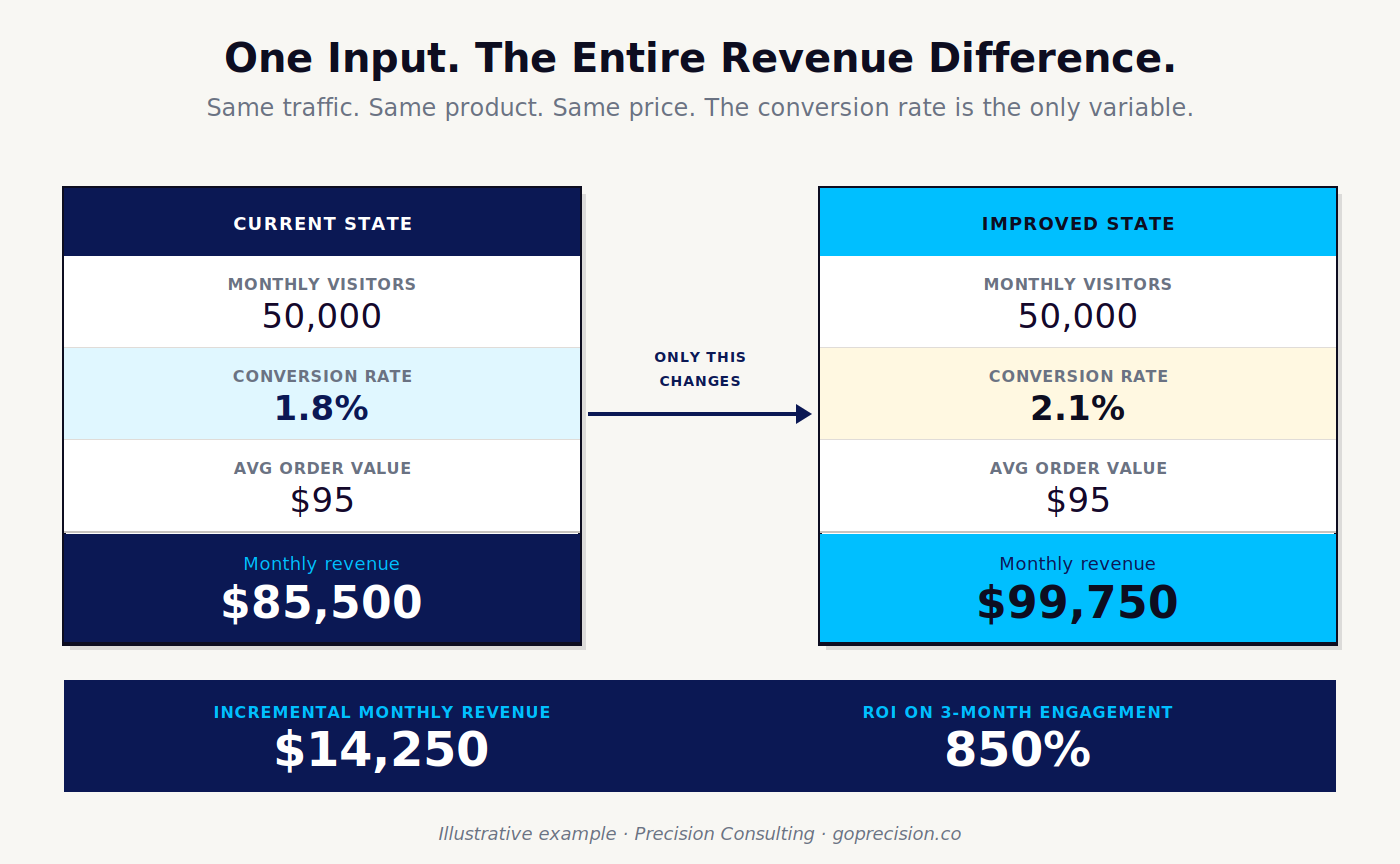
The four-step CRO ROI formula. All inputs are available before any work begins.
Why most founders underestimate the ROI of CRO
Two numbers consistently catch people out: the baseline revenue at stake, and the compounding effect of a sustained improvement. Most founders focus on the improvement percentage. That is the wrong starting point.
The baseline revenue at stake
Start with the revenue number, not the rate. A store with 100,000 monthly visitors converting at 2% with an average order value of $80 is generating $160,000 per month. A 15% relative improvement in conversion rate produces an additional $24,000 per month. Annually, that is $288,000 in additional revenue from the same traffic with no increase in ad spend. The revenue at stake scales directly with traffic and average order value. Most businesses focus CRO on conversion rate alone and leave the AOV lever untouched. Our article on why your average order value is low covers the diagnostic for what is suppressing AOV before you factor it into your projections.
The compounding effect
A single test that wins applies to next month and every month after. Unlike paid acquisition, which produces revenue while the spend is active and stops when it stops, a conversion rate improvement persists. A checkout improvement that lifts conversion by 12% in month one still produces that 12% lift in month twelve, against whatever traffic the store has at that point. As the business grows, the same improvement produces more revenue without any further investment.
A store improving conversion rate from 2.0% to 2.3% on $100,000 monthly revenue produces $15,000 additional monthly revenue in year one. If the store grows traffic by 20% per year, the same improvement produces $18,000 additional monthly revenue in year two and $21,600 in year three. The work is done once. The return compounds with growth. That is not true of most marketing spend.
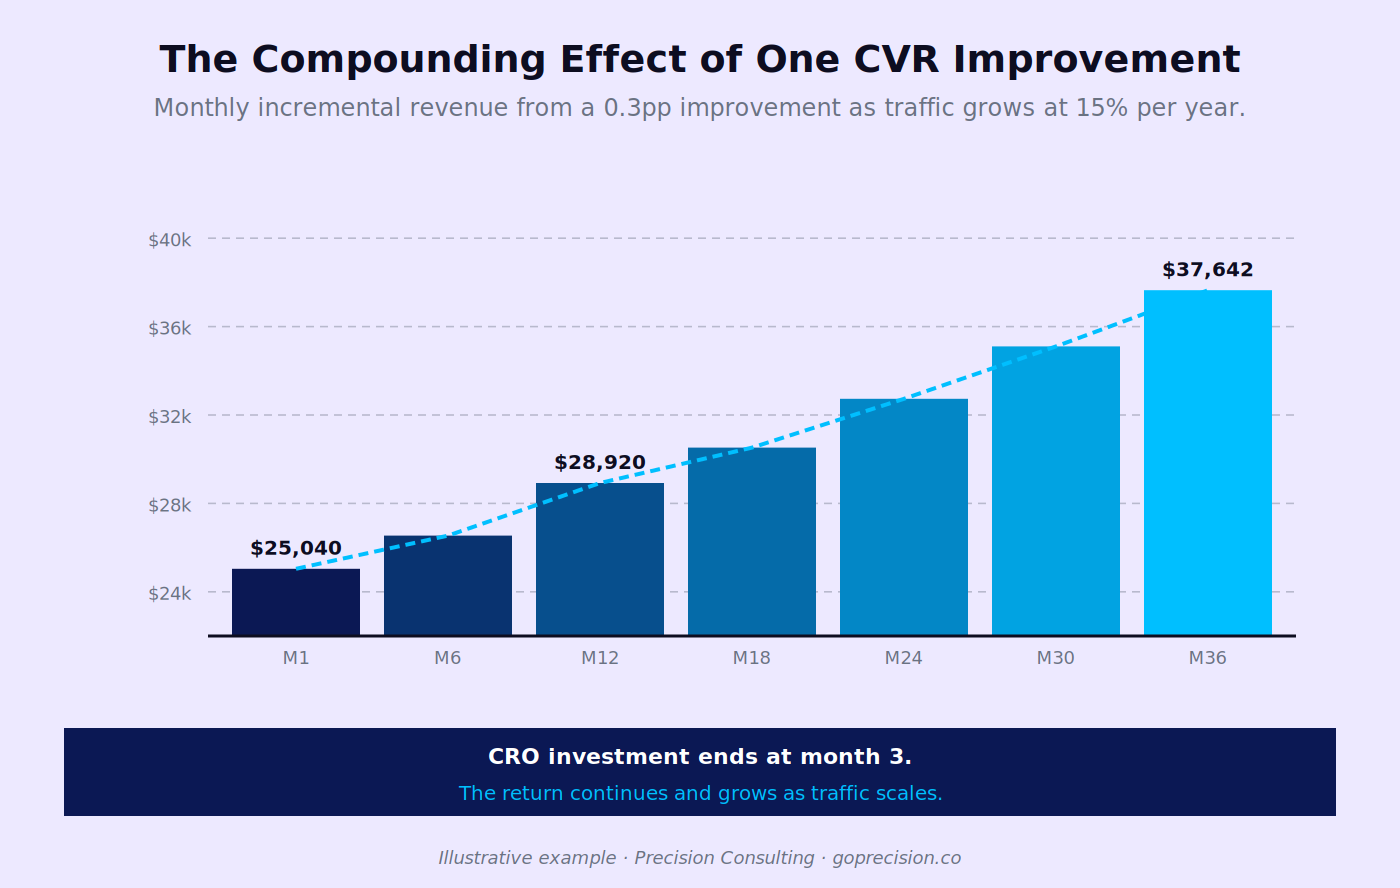
The compounding effect of a sustained conversion rate improvement. The same lift produces more revenue as traffic grows, with no additional optimisation spend.
Gabriel Weinberg and Lauren McCann's Super Thinking covers compounding as a mental model in depth: small, consistent improvements that build on a growing base produce returns that feel disproportionate to the initial input. This is not a CRO-specific insight. It is how every durable competitive advantage works. The mistake most founders make is evaluating CRO as a one-period cost against a one-period return, when the correct frame is a one-time investment against an expanding revenue base.
What to include in the cost side of the calculation
The cost side needs to include everything required to produce and sustain the improvement. Most founders only count the agency fee and miss the rest.
External costs
- Agency or consultant fees
- A/B testing tool subscription, if one is being used. Tools like VWO or AB Tasty typically run $200 to $2,000 per month depending on traffic volume
- Behaviour analytics subscription (Hotjar, Microsoft Clarity, or similar)
- Design and development costs for implementing winning variants permanently
Internal costs
Founder or team time spent on research, test review, and implementation represents a real resource. At a conservative $100 per hour and 10 hours per month of internal involvement, that adds $1,000 per month to the true cost. Most CRO ROI calculations omit this because it is an opportunity cost rather than a direct spend. It still represents a resource that has to be justified by the return.
The correct comparison
Do not compare CRO cost to CRO return in isolation. Compare the CRO cost to the cost of acquiring the equivalent additional revenue through paid acquisition. If you are paying $40 CPM on paid social and converting at 2%, acquiring $14,250 of additional monthly revenue requires approximately $285,000 in ad spend at those economics. The CRO programme produces the same revenue for $4,500. That comparison makes the case clearer than the formula alone.
Include internal time in every cost calculation. The number most commonly omitted is internal team hours. If someone on your team is spending 10 hours per month on the programme, at a conservative $100 per hour, add $1,000 to your monthly cost figure. A complete cost calculation includes all of it, not just the invoice. The ROI still holds at that higher cost basis for any store with meaningful traffic.
If you want to run this calculation for your specific store before making a decision, request your free audit and we will work through the numbers with you using your actual traffic, conversion rate, and average order value.
How to run the calculation before committing to a programme
You do not need to have done any CRO work to run this calculation. The inputs are available right now. The approach is to run three scenarios rather than committing to a single projection.
Run conservative, moderate, and optimistic scenarios before committing. Conservative: 10% relative improvement. Moderate: 20%. Optimistic: 30%. If the conservative scenario produces a positive ROI over 12 months, the investment is justified without needing the optimistic outcome. If it only works in the optimistic scenario, the risk is higher and the case is weaker. Most well-executed programmes land somewhere between the conservative and moderate estimates. For category-level conversion rate data to anchor your estimate, our article on what a good conversion rate is for e-commerce covers the benchmarks by store type.
The minimum traffic threshold
CRO produces meaningful ROI above a minimum traffic threshold. Below approximately 10,000 monthly visitors, the revenue at stake at most conversion rate levels is too low to justify the cost of a structured programme. At 10,000 monthly visitors, a 2% conversion rate, and a $70 average order value, current monthly revenue is $14,000. A 20% relative improvement adds $2,800 per month. Against a $3,000 engagement cost, the ROI is marginal in month one and clearly positive from month two. Below 5,000 visitors, fix obvious friction rather than running a formal programme. Our article on A/B testing for founders covers the traffic requirements for valid testing in detail.
How the ROI calculation works with a real store example
Here is a full worked example using realistic store numbers.
Store profile
A UK-based homeware retailer. 75,000 monthly visitors. Current conversion rate: 1.6%. Average order value: $110.
Current monthly revenue
75,000 × 0.016 × $110 = $132,000
Engagement
Three-month programme covering product page, checkout, and mobile UX. Total cost: $6,500, including tool subscriptions.
Conservative improvement estimate
0.3 percentage points (a 19% relative improvement from 1.6% to 1.9%).
Projected monthly revenue at 1.9%
75,000 × 0.019 × $110 = $156,750
Incremental monthly revenue
$156,750 minus $132,000 = $24,750
Three-month incremental revenue
$24,750 × 3 = $74,250
ROI
($74,250 / $6,500) × 100 = 1,142%
At month twelve, with 15% traffic growth, monthly visitors are approximately 86,000. At the same 1.9% conversion rate, monthly revenue is approximately $179,400 versus $150,480 at the original rate. The additional revenue from the same improvement is $28,920 per month, with no further CRO investment. These are conservative assumptions. The actual improvement from a well-executed audit often exceeds 0.3 percentage points when significant friction is being removed.
- The formula: current traffic times improved conversion rate times AOV, minus current traffic times current rate times AOV, divided by total cost of work, multiplied by 100. Run it before committing to any engagement.
- Most founders underestimate the baseline revenue at stake. 100,000 monthly visitors at 2% conversion and $80 AOV is $160,000 per month. A 15% relative improvement adds $24,000 per month.
- CRO compounds as traffic grows. The same improvement produces more revenue as visitors increase. Work done once continues to return as the business scales.
- The correct comparison is CRO cost versus the cost of acquiring equivalent revenue through paid acquisition. CRO consistently wins this comparison for stores with meaningful traffic.
- Run three scenarios before committing: conservative (10% relative improvement), moderate (20%), and optimistic (30%). If the conservative scenario produces a positive ROI over 12 months, the investment is justified.
- Below 5,000 monthly visitors, a formal programme is difficult to justify economically. Fix obvious friction first. Above 10,000, the revenue at stake typically justifies a structured approach.
- The cost calculation must include internal team time, not just the agency fee. At $100 per hour and 10 hours per month, that is $1,000 per month added to the true cost.
Frequently asked questions
What is the ROI of CRO?
The ROI of CRO is the incremental revenue generated by a conversion rate improvement divided by the total cost of the optimisation work, expressed as a percentage. A 20% relative improvement in conversion rate on $100,000 monthly revenue produces $20,000 per month in additional revenue. Against a $5,000 monthly engagement cost, that is 300% monthly ROI. Because the improvement persists beyond the engagement period, the long-term ROI is significantly higher than the in-engagement calculation shows.
How long does it take to see ROI from CRO?
High-priority fixes that do not require A/B testing, such as checkout friction reduction, mobile usability improvements, or form field reduction, can produce measurable lifts within the first 30 to 60 days. Tested improvements take 30 to 90 days depending on traffic volume. Most well-run programmes reach clearly positive ROI within three months.
Is CRO worth it for small stores?
CRO is most economically justified above 10,000 monthly visitors. Below that threshold, the revenue at stake at most conversion rate levels makes formal programme costs slow to recover. For smaller stores, the priority is fixing obvious friction through session recording and usability analysis rather than running structured A/B test programmes. That work has a meaningful return even without a formal testing infrastructure.
What conversion rate improvement can I realistically expect?
A conservative planning assumption for a well-executed programme on a store that has not been previously optimised is a 15 to 25% relative improvement within the first three months. Some stores see more, particularly when the audit identifies significant friction in checkout or on mobile. Use 15% as your planning figure and treat anything beyond that as upside.
How do I calculate the cost of CRO?
Total cost includes agency or consultant fees, A/B testing tool subscriptions, behaviour analytics subscriptions, design and development costs for implementing winning variants, and internal team time. Internal time is the number most commonly omitted. If someone on your team is spending 10 hours per month on the programme, at a conservative $100 per hour, that is $1,000 per month in real opportunity cost. A complete cost calculation includes all of it, not just the invoice.
Most founders who run this calculation for the first time are surprised by how quickly the numbers justify the investment. The formula is not complicated. The inputs are all available before any work begins. The step most skip is running the conservative scenario, seeing a positive return, and using that as the decision threshold rather than waiting to feel certain. If you want to work through the numbers for your specific store, our services page explains how we approach the audit and what the engagement looks like.
Predictably Irrational by Dan Ariely. The chapters on anchoring explain why the comparison framing matters when presenting ROI to stakeholders. The CRO cost-versus-paid-acquisition comparison works because anchoring shifts how the same number is evaluated depending on what it is placed next to.
Super Thinking by Gabriel Weinberg and Lauren McCann. Covers compounding as a mental model and why small, consistent improvements produce outsized long-term returns. The chapter on compounding is directly applicable to understanding why a conversion rate improvement becomes more valuable as traffic grows.