Last updated:
"We should test that."
When most founders say this, what they actually do is just make the change. A new layout goes live. The checkout flow gets rearranged. A different headline replaces the old one. And then they compare last month's numbers to this month's numbers and call it a test.
It is not an A/B test. It is a before-and-after comparison with no controls, no isolation of variables, and no way to know whether the change caused the result or was due to seasonal traffic, a promotion that happened to overlap, or random fluctuation. The result looks real, but there is no way to trust it.
A true A/B test is different. It runs both versions simultaneously, splitting live traffic between them so external factors affect both groups equally. It uses statistical significance to determine whether the difference in results is real or just noise. And it requires enough visitors to detect a meaningful change.
A/B testing is not complicated. The tools handle the maths. Your job is the thinking: what to test, why, and what to do with the results.
At Precision, every experiment we design starts with a hypothesis rooted in behavioural psychology. That approach delivered +58% revenue over six months for a major delivery platform. Not from one lucky test. From a systematic series of experiments, each building on the last.

What most founders think is an A/B test (before/after comparison) vs. what a real A/B test looks like (simultaneous split with statistical significance).
What is A/B testing, and how does it differ from a before-and-after comparison?
A/B testing means showing two versions of something to two groups of visitors at the same time and measuring which one performs better. Group A sees the original (the "control"). Group B sees the variation (the "challenger"). Traffic is split randomly and simultaneously. You compare the results on a specific metric and pick the winner.
The keyword is simultaneously. That is what separates a real test from a before-and-after guess. When both versions run at the same time, external factors (day of week, promotions, seasonality, ad campaigns) affect both groups equally. The only difference between the groups is the change you are testing. So if one version outperforms the other, you can be confident the change caused it.
A before-and-after comparison cannot give you that confidence. Too many things change between periods. You will never know whether the improvement was due to your layout change or to the fact that it was payday week.
Step 1: Why do you need a hypothesis before running an A/B test?
You need a hypothesis before running an A/B test because without one, you do not know what you are learning, and you cannot generalise the result to anything else on the site. A hypothesis is a falsifiable prediction: if we change X, we expect Y to happen, because of Z. Most founders make a mistake here. Instead of questioning why the current button is not effective, they jump straight to testing a different button colour.
A good hypothesis has three parts:
- The change: What you are going to modify. Be specific. "Changing the CTA from grey to high-contrast cyan and making it the only element on the page in that colour."
- The expected outcome: What metric do you expect to improve? "Increase add-to-cart rate."
- The reasoning: Why you believe this will work, ideally grounded in psychology or data. "The Von Restorff Effect predicts that visually distinctive elements are more likely to be noticed and acted on. Our heatmap data shows that less than 30% of users are clicking the current CTA."
Without the reasoning, you are testing randomly. With it, you learn something regardless of whether the test wins or loses. If it wins, you have validated the principle. If it loses, you have learned the bottleneck is somewhere else.
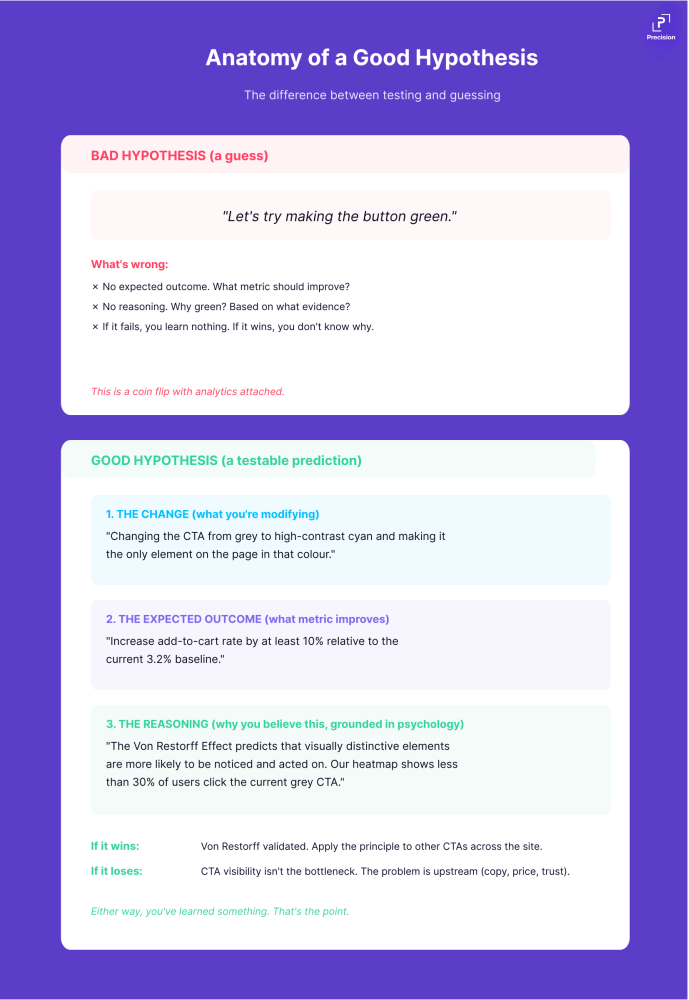
Anatomy of a good hypothesis vs. a bad one. Bad: "Let us try a green button." Good: Change + expected outcome + reasoning grounded in psychology.
Step 2: How do you choose the right thing to A/B test?
Not everything is worth testing. The goal is maximum learning per test, and you have finite traffic.
Test big changes first. A completely restructured product page teaches you more than a change to the headline font. At a leading food delivery platform, our first major test was a full redesign of the homepage layout, not a button tweak. It delivered +40% conversion. Start with structural changes, then fine-tune.
Test where the biggest drop-off is. Check your funnel analytics. If 70% of visitors leave the product page without adding to the cart, that is where to focus. The product page design guide shows the eight elements most worth testing first. If cart abandonment is the leak, test the checkout. Fish where the fish are. Not sure where your biggest leaks are? The CRO audit checklist walks through ten specific areas to diagnose first.
Do not test multiple things at once. If you change the headline, the image, and the CTA simultaneously, you will not know which change caused the result. One variable per test. Run them in sequence.
Step 3: How much traffic and time does an A/B test need to be valid?
An A/B test needs enough traffic to detect a meaningful effect, and enough runtime to cover a full business cycle. For most e-commerce stores that means at least two full weeks and several thousand visitors per variant. Anything less and you are reading noise. This is the part that intimidates people. It should not.
How much traffic do I need?
The answer depends on your current conversion rate and the size of the improvement you want to detect. Rule of thumb: to detect a 20% relative improvement on a 2% conversion rate (moving from 2.0% to 2.4%), you need roughly 4,000-5,000 visitors per variation. At 10,000 monthly visitors, that is a 2-4 week test.
The concept behind this is statistical power. A well-designed experiment needs a sufficiently large sample size to have an 80% or greater chance of detecting a real effect, a threshold established in Jacob Cohen's foundational work on Statistical Power Analysis for the Behavioral Sciences (1988) and adopted across all major testing platforms. Too small a sample and you will miss real improvements (false negatives). Too large and you are wasting time testing changes that are already clearly significant.
If you have fewer than 5,000 monthly visitors, formal A/B testing is not practical yet. Focus on evidence-based changes instead and save testing for when you have more traffic.
How long should I run the test?
Until it reaches statistical significance. Not until it looks like one version is winning. Not for exactly 7 days. Until the maths says you can trust the result.
The standard is 95% confidence, meaning there is only a 5% chance the result is a fluke. This threshold is the widely accepted benchmark for experimental research, used by Optimizely, VWO, and Google Optimize, and grounded in the Neyman-Pearson hypothesis testing framework. Most testing tools calculate this for you automatically. You do not need to understand the maths. You need to understand the principle: do not stop early.
Common and expensive mistake: stopping a test because one version is ahead on day 3. Results fluctuate wildly in the first few days. A version that is "winning" on day 3 might lose by day 10. Run the full test, or you are making decisions on noise.
What do I measure?
Primary metric (the success metric): Pick one. Not three. One. If you are testing a product page change, your primary metric is the add-to-cart rate. If you are testing checkout, it is the completion rate. The test is decided on this metric alone.
Guardrail metrics (the safety net): These are the metrics you monitor to make sure your test is not accidentally hurting the business while improving the primary metric.
- Revenue per visitor: the ultimate business health check. If this drops, something is wrong regardless of what the primary metric says.
- Bounce rate: are you driving people away from the page entirely?
- Average order value: especially important when testing cart or checkout changes. A higher conversion rate with a lower AOV might mean less total revenue.
- Return/refund rate: some changes (aggressive urgency tactics, misleading copy) increase conversions short-term but generate returns.
- Page load time: if your variation adds heavy scripts or images, speed drops kill conversions elsewhere.
You do not stop a test because a guardrail metric dips slightly. You stop a test if a guardrail metric shows a significant, sustained decline that would outweigh the improvement in the primary metric.

Primary metric vs. guardrail metrics: the success metric decides the test, guardrail metrics protect the business.
Step 4: How do you run an A/B test without contaminating the results?
Once your test is live, the hardest part is doing nothing. Do not peek at results and draw conclusions. Do not end it early. Do not make other site changes that contaminate the data.
- Split traffic 50/50. Equal traffic to both versions. Any other split reduces statistical power and extends test duration.
- Run for at least one full business cycle. Buying behaviour changes throughout the week. A test that runs Monday to Thursday misses weekend shoppers. At minimum, one full week; ideally, two.
- Do not change anything else. If you launch a promotion, change navigation, or update pricing while a test is running, the results are contaminated. Pause the test or wait.
Step 5: How do you read A/B test results and decide what to do next?
Read A/B test results by checking three things: did it reach statistical significance, was the effect size large enough to justify rolling out the change, and is the result consistent across your key traffic segments. When the test reaches significance, you have three possible outcomes:
- Clear winner: one version significantly outperforms the other on the primary metric, and guardrail metrics are stable. Implement the winner and move on.
- No significant difference: the change did not matter. This is still valuable. You have learned that this element is not the bottleneck. Go deeper.
- Surprising result: the variation performed worse. Do not ignore this. Investigate why. Sometimes a losing test reveals a more important insight than a winning one.
Document everything. The hypothesis, the setup, the duration, the result, the guardrail impact, and what you learned. This becomes your experimentation playbook, and its value compounds over time.
This is the kind of analysis we run in a Precision Deep Dive Audit. If you want to see exactly where your store is leaking revenue, request your free audit and we will walk through it together.
What tools do you actually need to run an A/B test?
- Free/cheap: VWO (free tier), Shopify's built-in testing, Google Tag Manager for event tracking.
- Mid-range ($50-$200/month): VWO, Optimizely, Convert. Visual editors, automatic traffic splitting, and significance calculators built in.
- What you do not need: a data science team, custom experimentation platforms, or statistical expertise beyond understanding confidence levels. The tools handle the maths. Your job is the hypothesis.
What are the most common A/B testing mistakes founders make?
- Testing without a hypothesis. "Let us see what happens" is not a test. It is a coin flip with analytics attached.
- Stopping tests too early. Day 3 results are noise. Wait for statistical significance. Every single time.
- Testing tiny changes on low traffic. If you have 5,000 monthly visitors and you are testing font sizes, you will wait 6 months for a result that does not matter.
- Ignoring guardrail metrics. A test that boosts add-to-cart but tanks checkout completion is a net loss. Always monitor the full funnel.
- Not documenting results. If you cannot remember what you tested last quarter, you are starting from scratch every time. The playbook is the asset.
Super Thinking by Gabriel Weinberg and Lauren McCann has an excellent chapter on statistical significance, false positives, and experimental design. Highly recommended for founders who want to go deeper into the maths behind A/B testing.
Key Takeaways
- A real A/B test runs both versions simultaneously, with traffic split randomly. A before-and-after comparison is not a test.
- Always start with a hypothesis: the change, the expected outcome, and the reasoning (ideally backed by psychology).
- Test big changes first, test where the biggest drop-off is, and isolate one variable at a time.
- Use a primary metric to decide the test and guardrail metrics (revenue per visitor, bounce rate, AOV, returns) to protect the business.
- Wait for 95% statistical significance. Early results are noise. Document everything.
Frequently Asked Questions
How much traffic do I need for A/B testing?
Minimum 10,000 monthly visitors for reliable testing. Below that, focus on evidence-based changes rather than formal split tests. You need enough traffic to reach statistical significance within a reasonable timeframe.
How long should I run a test?
Until it reaches 95% statistical significance, and for at least one full week. Most e-commerce tests take 2-4 weeks, depending on traffic and the size of the effect you are trying to detect.
What should I test first?
The page with the biggest funnel drop-off. Check Google Analytics for where visitors leave. High product page abandonment? Test the product page. High cart abandonment? Test checkout. Start with the biggest leak. The page that loses the most revenue is also the page where a small lift produces the largest absolute return.
What if my test shows no difference?
That is still a result. It means the element you tested is not the bottleneck. Go deeper. Every "no result" narrows the search for what actually matters.
Want a structured testing programme for your store? See how Precision works with e-commerce brands, or book a strategy session to walk through your highest-impact test opportunities.
