Last updated:
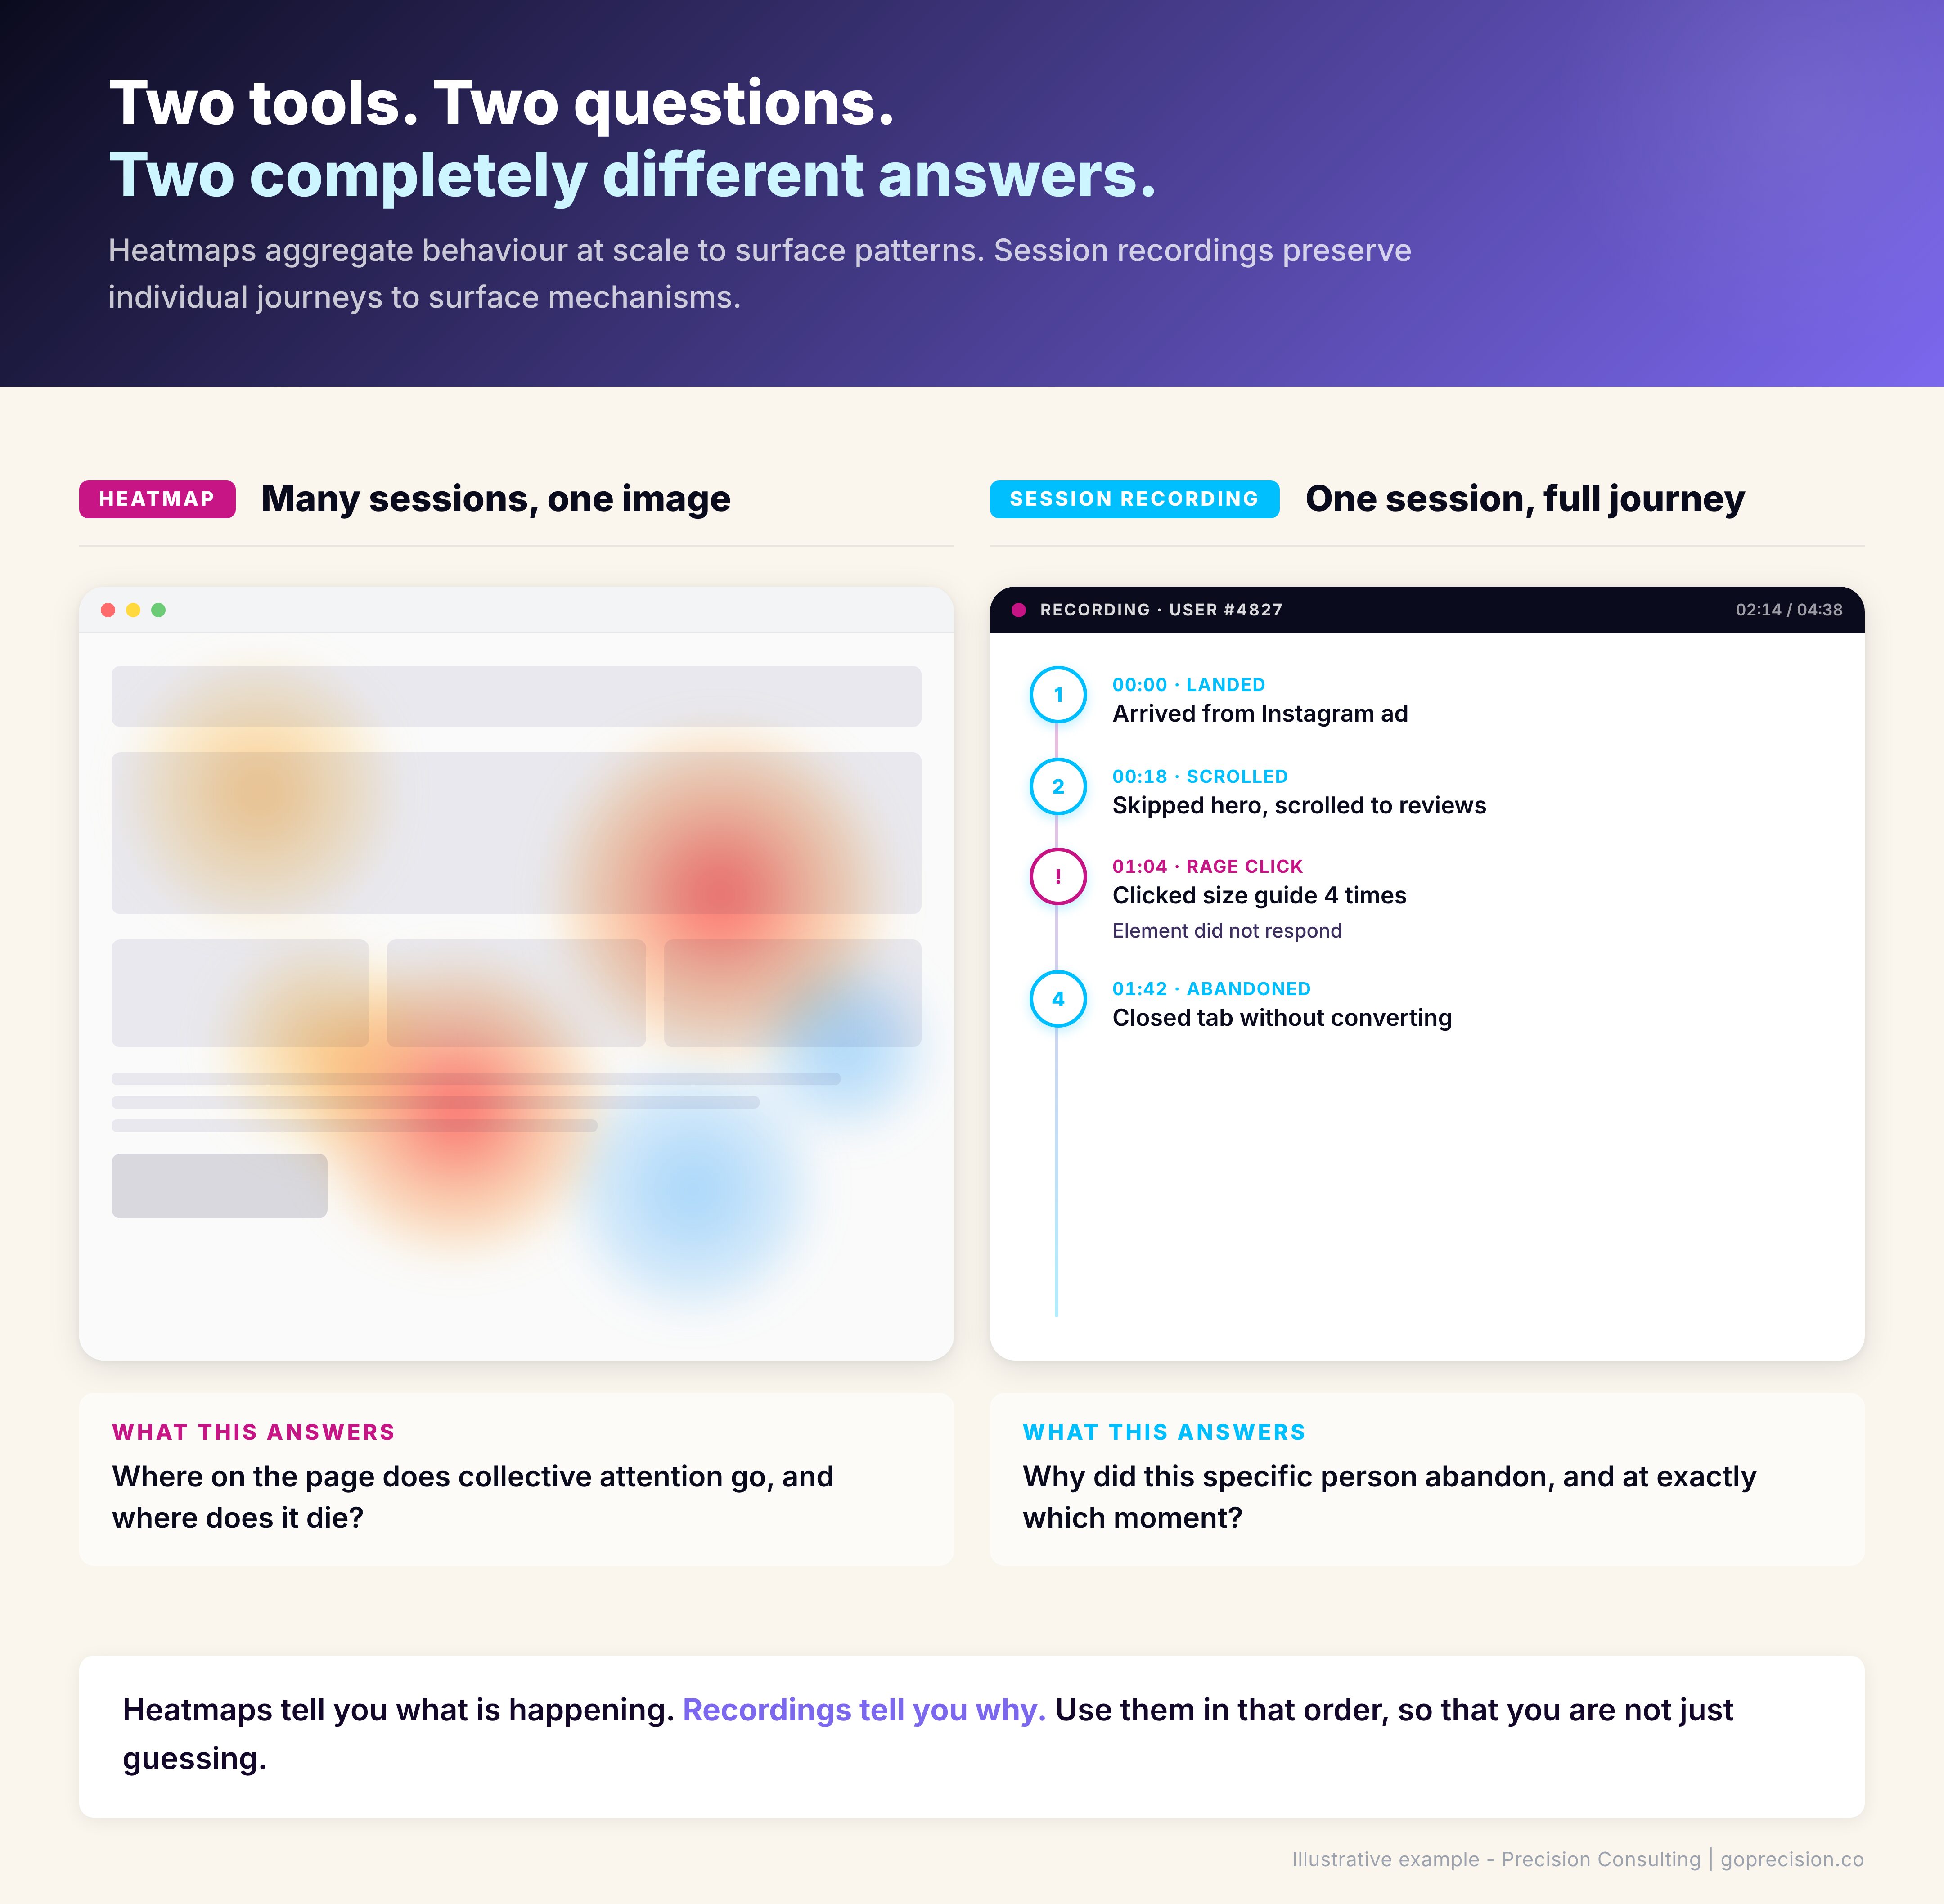
Heatmaps and session replays are the two most common behavioural analytics tools in conversion rate optimisation, and they answer fundamentally different questions. Heatmaps aggregate behaviour across many sessions to surface patterns at scale. Session replays preserve individual journeys to surface the mechanisms behind those patterns.
What I see most often at Precision is a store that installed Hotjar in its first month, opened it twice, and never looked at it again. The tool is not the problem. The question they were trying to answer is.
A founder who has watched fifteen session replays and drawn no conclusions is not a founder with bad tools. They are a founder who started watching before they had a hypothesis.
Steve Krug's Don't Make Me Think established the usability heuristics that make replays analysis productive. Daniel Kahneman's Thinking, Fast and Slow covers the cognitive biases that distort how we read both kinds of data. Before you install either tool, decide what you are trying to learn. That decision determines which one gets you there.
| Heatmaps | Session replays | |
|---|---|---|
| Best for | Finding which pages have a problem at scale | Diagnosing what is breaking on a known problem page |
| Question answered | Where does attention land and stop? | Why is this specific person leaving? |
| Sample size | Aggregated across hundreds of sessions | Individual sessions, qualitative |
| Use it | First. To surface where the problem is. | Second. After heatmaps point you to a page. |
| Strongest signal | Scroll depth, click clusters, dead zones | Rage clicks, form-field abandonment, hesitation |
What do heatmaps actually tell you?
Heatmaps tell you what is happening on a page at scale by aggregating behaviour across many sessions into a single image. Click maps show where the collective attention goes. Scroll maps show how far down the page visitors actually travel. Attention maps show where the cursor lingers and where it does not.
That aggregation is the whole point. It is also the whole limitation. A weather map tells you it rained across the whole city. It does not tell you whose roof was leaking. Heatmaps work on the same principle. They tell you what happened at the population level, and they are silent on the individual experience.
You did not know which sections were invisible to your visitors
Scroll depth patterns. If 60% of your visitors never see the section where your strongest testimonials live, the testimonials are not underperforming. Their placement is. A scroll map tells you that within a week of installing the tool.
Dead clicks. People clicking an image expecting it to expand. Clicking a product price expecting it to open size options. Clicking a block of text because the design signalled it was interactive when it was not. Each dead click is a broken mental model, and a click map surfaces every one of them.
Attention distribution. Which CTAs get ignored. Which sections are effectively invisible. Which hero images steal attention from the elements that were supposed to do the conversion work. Heatmaps make these invisible problems visible.
You are asking the heatmap a question it cannot answer
Sequence. A heatmap does not tell you the order in which things happened. You see that 40% of visitors clicked the size guide and 30% clicked add-to-cart, but not whether the size guide click came before or after the add-to-cart attempt.
Individual behaviour. You see the aggregate. The person who scrolled to the bottom, back to the top, then abandoned is blended into the same heatmap as the person who bought on the first pass.
Causation. You see what happened, not what drove it. A cold spot on your homepage might be a boring section, or it might be a section people have already mentally absorbed and moved past. The heatmap does not distinguish between the two.
Heatmaps answer the question: what is happening at scale on this page? That is a useful question. It is not the only question worth asking. A founder who treats it as the only question will keep finding patterns and never find mechanisms.
What do session replays actually tell you?
Session replays tell you why specific behaviour happened by replaying one user's full journey on your site as a video. Mouse movement, clicks, scrolls, form inputs, the sequence of pages visited, and the moments where they hesitated. Where heatmaps aggregate, replays individualise.
Your funnel chart is hiding the friction from you
Friction you cannot see from a funnel chart. Your analytics tells you 40% of people abandon at the shipping step. Replays tell you they are abandoning because the postal code field is rejecting valid inputs, or because the delivery time estimate appears only after the shipping rate, confusing the sequence of decisions.
Rage clicks. Three, four, five clicks on the same element in quick succession. This is a frustration signal that no aggregate view can give you. One rage-click pattern across ten repplays tells you something is broken on that element, and it tells you before your support inbox starts filling up.
Form field abandonment. Heatmaps show you where people clicked the field. Replays show you they typed three characters, deleted everything, tried again, and left. That second-order behaviour is where the actual friction lives. According to the Baymard Institute, the average e-commerce checkout uses 23 form elements against an optimum of 12 to 14. Session replays of checkout flows routinely show exactly which fields in that surplus are causing the drop-off, something no funnel report can isolate on its own.
Surprise patterns. Behaviour you would not have thought to look for. The user who opened and closed the size chart six times before deciding. The user who copied the product description and pasted it into a new tab presumably to search for reviews elsewhere. These moments suggest things your funnel dashboard will never flag.
You are mistaking one vivid replay for a pattern
Statistical significance. Watching one person rage-click a button does not mean the button is broken for everyone. You need pattern density before you can treat a replay insight as a real signal.
Scale. You cannot watch a thousand replays. You can watch ten, maybe twenty in a sitting. That sample is rarely representative of your full traffic.
The typical user. Replays are biased towards the unusual. The person who spent eleven minutes on your site and behaved strangely is much more memorable than the three-minute purchase that converted cleanly. The brain assigns disproportionate weight to events that are vivid, unusual, or recent. This is the availability heuristic at work. A replay of someone fighting a broken checkout flow for seven minutes burns into memory faster than ten clean two-minute purchases. Structured filtering compensates for this. Gut instinct, when reviewing replays, does not.
Replays answer the question: why did this specific thing happen to this specific person? That question is the one that cracks open specific friction points. It is not the question that tells you what to fix first. Skip the funnel and the heatmap, and you will be fixing the wrong thing first.
When should you reach for heatmaps versus replays?
Reach for heatmaps first to find the pattern, then reach for session replays to confirm the mechanism. Watching replays before you know what pattern you are looking for produces the I-watched-twenty-sessions-and-learned-nothing outcome. You were not watching for anything, so you saw nothing.
Start with the funnel. Google Analytics, GA4, or whatever analytics you use. Find the step in your journey with the biggest drop-off relative to industry norms. That step is your diagnostic target. Then, heatmap that page first, and replays second.
The heatmap tells you what is happening on that page at scale. Are people scrolling past the primary CTA? Ignoring a module you thought was central? Clicking something that does not respond? The heatmap surfaces the pattern.
Once you have a pattern, session replays confirm the mechanism. You already know 40% of cart visitors never get to checkout. The heatmap tells you they are all abandoning around the shipping estimate. Now you watch fifteen replays of people who dropped off at that exact point, and the why becomes visible. Maybe the estimate loads after a three-second delay, and people leave before it appears. Maybe the cost is displayed in a tone that feels like a warning rather than an expectation. You cannot see any of that from aggregated clicks.
The mistake is reversing the order. Watching replays before you have a pattern wastes your afternoon and produces no decisions. By the time you realise nothing came of it, the pattern your heatmap could have surfaced in ten minutes is still costing you conversions.
Heatmaps come first to find the pattern. Replays come second to confirm the mechanism. Reversing the order is the most common diagnostic mistake.
This is the kind of analysis we run in a Precision Deep Dive Audit. If you want to see exactly where your funnel and behaviour data are pointing, request your free audit and we will walk through it together.
Which mistakes are most common with each tool?
What I see when CRO analysis fails is rarely a tooling problem. The tools work. The mistakes cluster into two groups. Heatmap mistakes are about reading too much from too little data. Replay mistakes are about watching without a question.
You are reading a map that your traffic has not earned yet
Reading a heatmap built on too little traffic. A scroll map built on 200 sessions is decorative, not diagnostic. Calling patterns from a sample that small is like flipping a coin three times, getting three heads, and concluding the coin is rigged. You need enough sessions that the aggregate represents real behaviour, which generally means at least a few thousand recorded visits per page before the patterns stabilise. Your homepage hits that threshold fast. A seasonal landing page might never hit it.
Confusing click density with conversion contribution. A heatmap that lights up bright red on your social icons is not a success. It is a distraction signal. Your visitors are clicking away from the purchase decision. Red does not mean good. It means something is getting clicked, and whether that is good depends entirely on what it is.
Not segmenting by device. Your desktop heatmap and your mobile heatmap are two different documents. Looking at a blended view hides the mobile friction that is costing you most of your revenue. Always segment. Our mobile CRO guide covers what to look for once you have segmented.
Treating the map as the answer. The heatmap is the prompt. It tells you where to look more closely. A founder who reads a heatmap, makes a change, and moves on has skipped the validation step entirely.
You sat down to watch replays without a question in mind
Watching without a hypothesis. The single most common way to waste a working afternoon. Replays without a question feel productive and produce nothing. It is the equivalent of a detective arriving at a crime scene, looking around for an hour, and leaving without having formed a theory about what happened. The information was all there. Without a question to organise it around, none of it cohered into something actionable.
Start with a specific thing you are testing: why are users abandoning at checkout step two? Watch fifteen replays of people who dropped off at that exact step. Do not watch general replays.
Drawing conclusions from three sessions. Three rage clicks across three replays might be a pattern. It might be three people having bad internet connections. Rule of thumb: watch at least ten replays of the same behaviour before you treat it as a signal worth acting on.
Not filtering. Most session replay tools let you filter for rage clicks, errors, long sessions, or specific page sequences. If you are watching replays unfiltered, you are watching noise. Filter first.
Ignoring quiet, successful sessions. The person who converted in two minutes with no visible friction is also telling you something. Specifically: what is working. Half the value of session replay analysis is understanding why the successful journeys went smoothly, so you can protect that pattern in future design decisions.
How do you combine heatmaps and replays into a diagnostic sequence?
The diagnostic sequence runs in six steps: funnel analysis, heatmap, hypothesis, replays, fix, and measure. Each step answers a different question. Skip a step, and the diagnosis gets weaker.
- Funnel analysis. Identify the step with the largest drop-off. This is your investigation target.
- Heatmap the page. Look at click density, scroll depth, and attention distribution on the page where the drop-off is happening. Segment desktop from mobile.
- Form a hypothesis. Based on the heatmap pattern, guess what is going wrong. Users are not reaching the CTA because scroll depth drops at 40%. Or: users are clicking the shipping estimate as if it is interactive, but it is static text.
- Session replays to validate. Filter for users who dropped at that exact step and matched the relevant device. Watch ten to fifteen. Confirm whether your hypothesis holds.
- Identify the fix. Now you know the pattern, the mechanism, and the specific behaviour. The fix is the smallest change that addresses the root cause.
- Ship the change, then measure. Go back to the funnel. Has the drop-off moved? If yes, you fixed the right thing. If no, your hypothesis was wrong, and the heatmap is pointing elsewhere.
Every step in this sequence answers a different question. Skip the heatmap, and you miss the pattern. Skip the replays, and you are guessing at the mechanism. Skip the funnel, and you are solving a problem that might not matter. If the fix you ship is meaningful, our A/B testing for founders guide covers how to validate it before you commit to it sitewide.
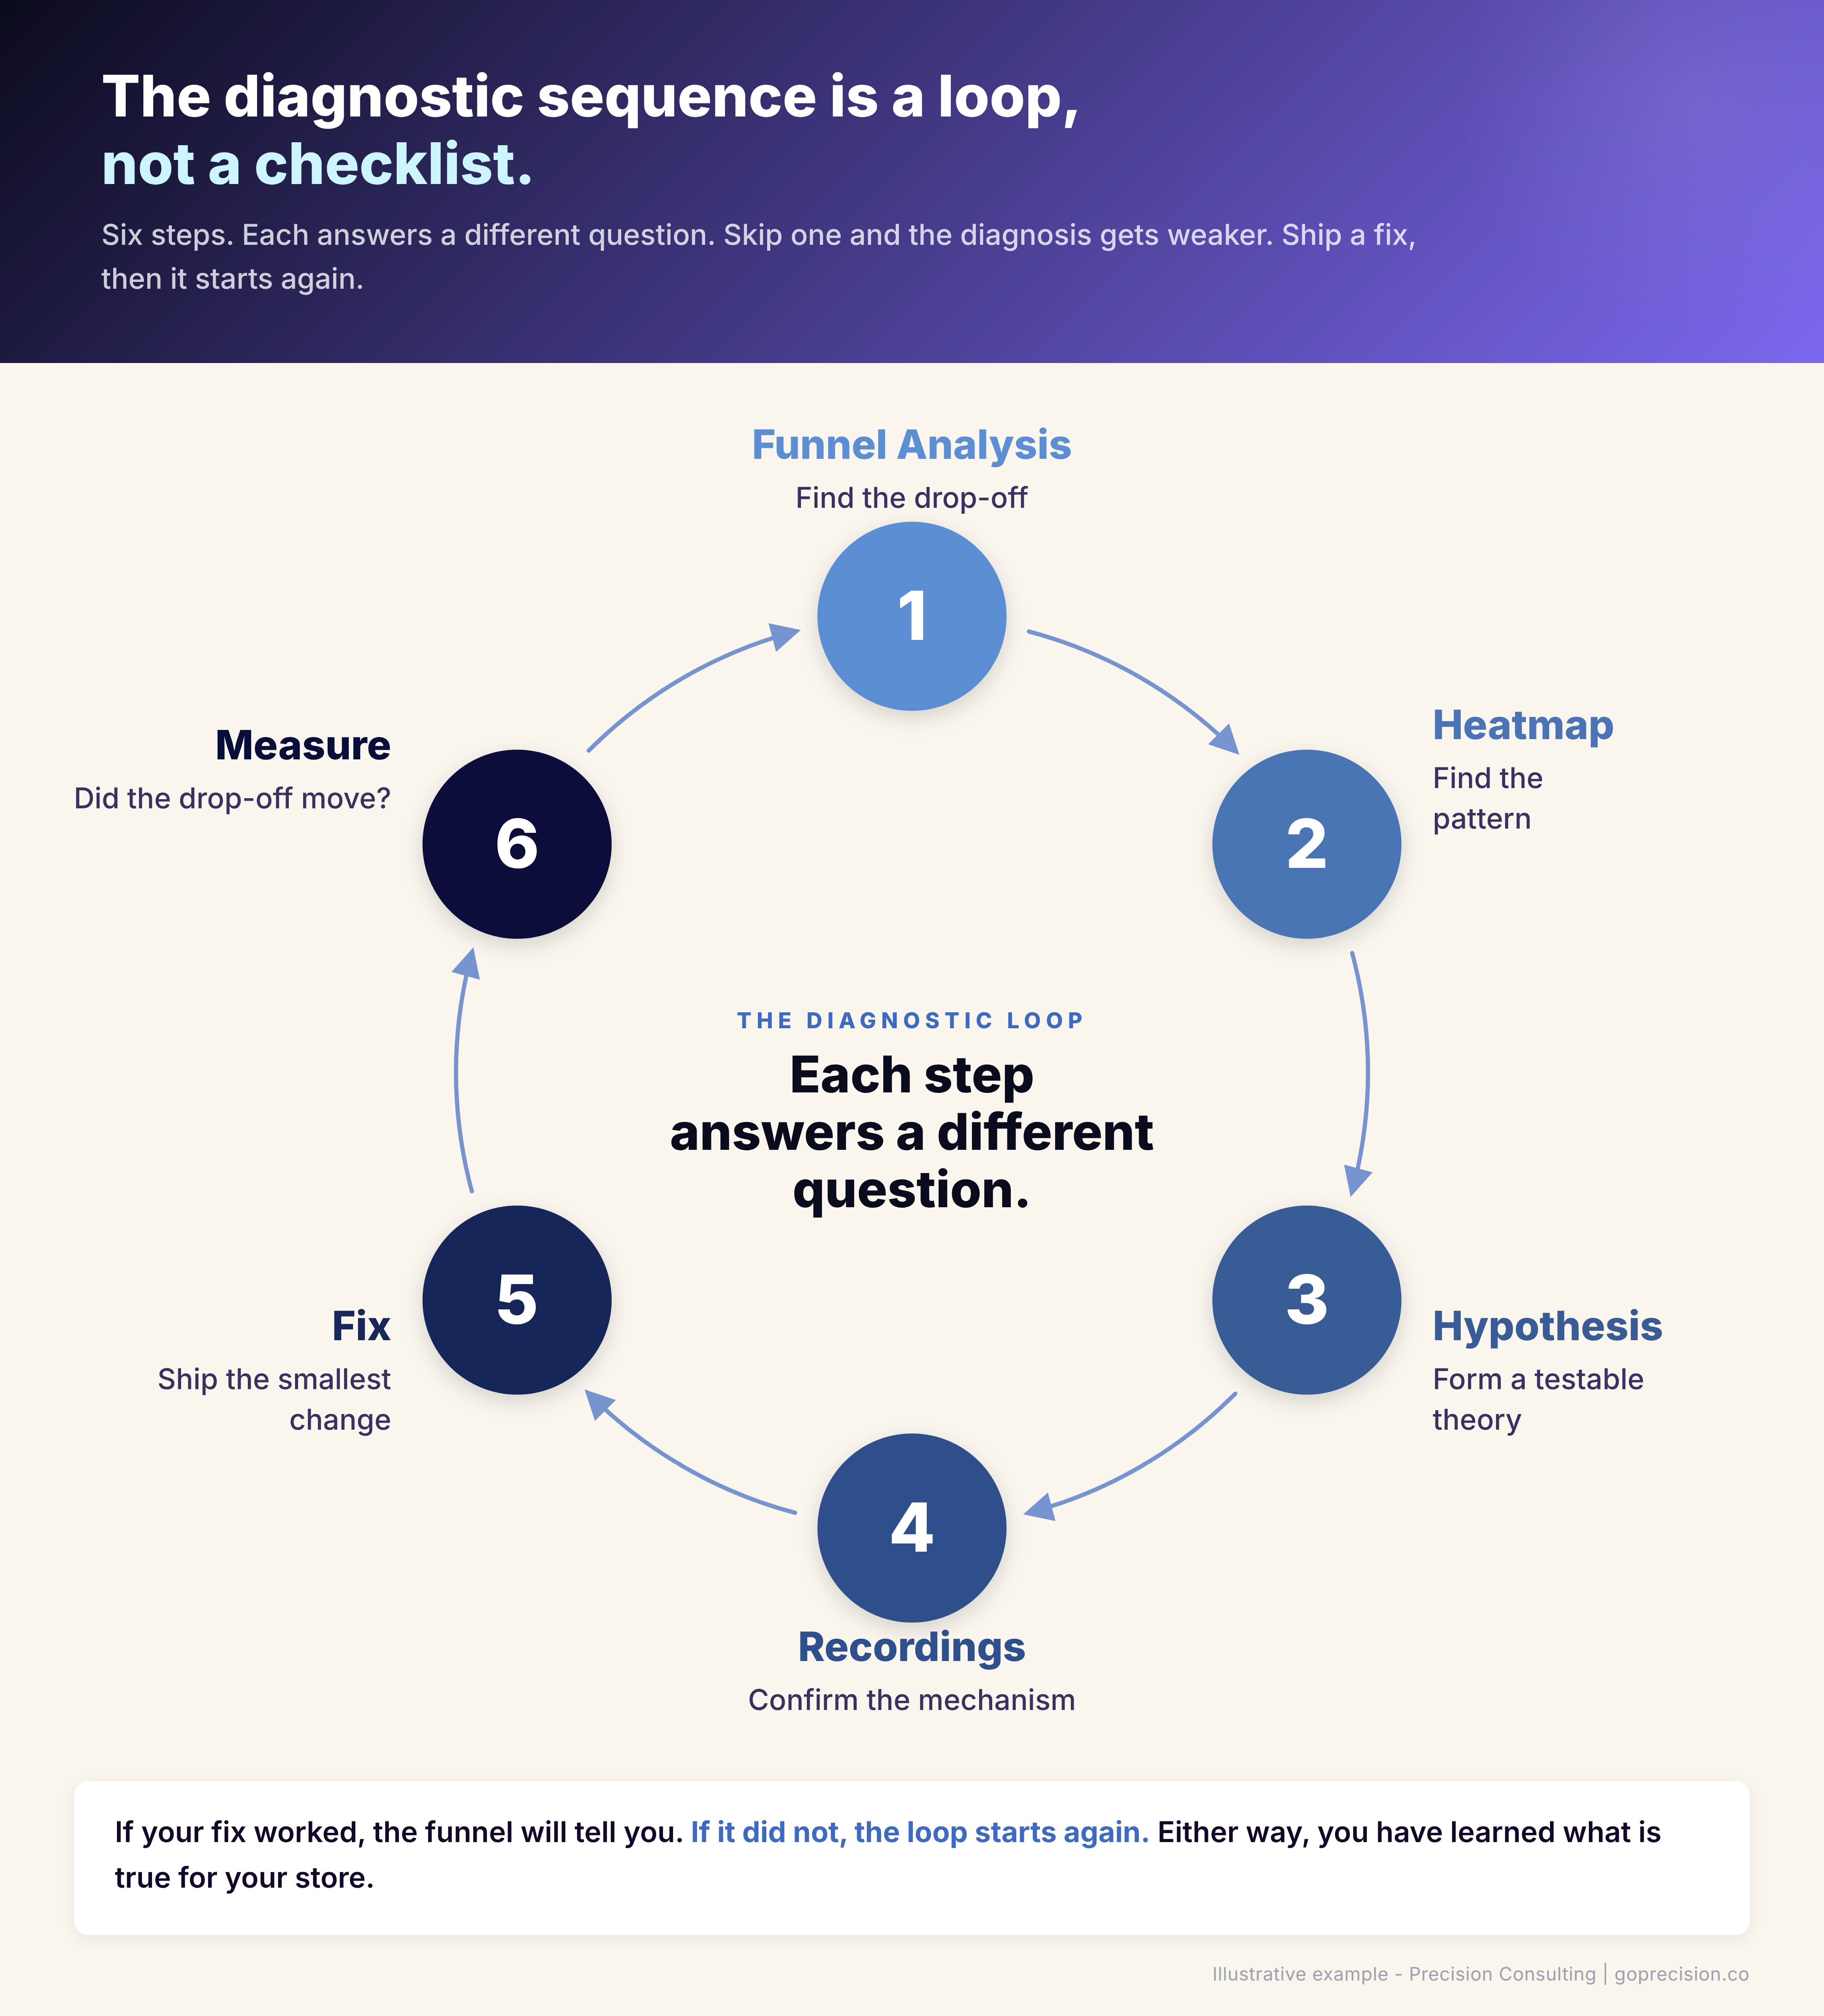
The diagnostic sequence: each step answers a different question. Skip one and the diagnosis gets weaker.
Which heatmap and session replay tools are worth using?
Hotjar, Microsoft Clarity, and FullStory are the three behaviour analytics tools I would actually recommend, and the choice between them is rarely the bottleneck. You do not need expensive software for either job. You need one tool, set up properly, and actually used.
Hotjar covers both heatmaps and session replays in one product. The free tier is enough for most stores under 50,000 monthly sessions.
Microsoft Clarity is free at any volume and increasingly competitive with Hotjar's paid tiers. Worth installing on a secondary environment or staging site.
FullStory is a level up, better for larger sites that need deeper analytics, event tracking, and workflow replay. Overkill for a store doing under 100,000 sessions a month.
Do not install three tools. Pick one, set it up properly, and actually use it. The second-most-common way CRO analysis fails, after watching replays without a hypothesis, is having three analytics products and treating none of them as the source of truth. Three half-configured tools cost you the same monthly time as one well-configured tool, and produce nothing.
Our broader best CRO tools guide covers the full analytics stack, including testing platforms and survey tools that complement what heatmaps and replays give you.
Where should you start this week?
If you have neither tool installed, I would start with Hotjar or Clarity on the free tier. Install on your top three pages: homepage, main product page, and cart. That is where the revenue-moving friction usually sits.
Let it collect data for a minimum of two weeks. A heatmap built on less than a couple of thousand sessions is not diagnostic.
Then, once a week for the next month, block 45 minutes on your calendar and do this:
- Pull your funnel report. Find the largest drop-off.
- Open the heatmap for that page. Look at scroll depth, click map, and mobile separately from desktop.
- Form one hypothesis about why the drop-off is happening.
- Watch ten session replays of users who match that pattern.
- Write down what you saw, what you learned, and what you will test next.
That is the loop. It produces more conversion insight in an hour than a month of opening dashboards and hoping something jumps out. Founders who run this loop every week for a month see specific friction points they had been guessing about for years. The ones who do not run it stay guessing.
If your drop-off lives at checkout, our checkout optimisation playbook covers the eight friction points where most of that revenue is lost. If your drop-off lives earlier in the funnel, the CRO audit checklist covers the sitewide diagnostic.
Want help running this loop on your specific funnel? See how Precision works with e-commerce brands, or book a free strategy call and we will look at your behaviour data together.
Steve Krug's Don't Make Me Think is the foundational text on usability heuristics and the kind of thinking that makes session replay analysis productive. Daniel Kahneman's Thinking, Fast and Slow covers the cognitive biases that shape how we interpret what we see in analytics data, including why we so often find patterns that are not there.
Key Takeaways
- Heatmaps and session replays answer different questions. Heatmaps show what is happening at scale. Replays show why it is happening to individuals.
- Use heatmaps to find patterns. Use replays to validate mechanisms. Using them in the opposite order is the most common reason CRO analysis produces nothing useful.
- A heatmap built on too little traffic is decorative, not diagnostic. Aim for at least 2,000 to 3,000 recorded sessions per page before you read patterns off it.
- Session replays without a hypothesis are a time sink. Always watch filtered replays tied to a specific funnel drop-off.
- Watch at least ten replays of the same behaviour before you treat it as a signal. Three rage clicks across three sessions might be a coincidence.
- You do not need three analytics tools. One, set up properly and actually used, beats a stack that sits idle.
- The diagnostic sequence is funnel analysis to find the drop-off, heatmap to find the pattern, replays to confirm the mechanism, and then the fix.
Frequently Asked Questions
What is the difference between heatmaps and session replays?
Heatmaps and session replays are both behavioural analytics tools, but they answer different questions. A heatmap aggregates clicks, scrolls, and attention from many sessions into a single image to show patterns at scale. A session replay replays one user's full journey on the site as a video. Heatmaps tell you what is happening across visitors. Replays tell you why it happened to a specific person.
Should I use heatmaps or session replays first?
Heatmaps first. Replays require a hypothesis to be useful, and heatmaps are where the hypothesis comes from. Watching replays without a pattern to look for is how most founders waste their first month with a CRO tool.
How much traffic do I need for heatmaps to be useful?
Enough that the aggregate represents real behaviour. For a homepage or main product page, that usually means at least 2,000 to 3,000 recorded sessions before the patterns stabilise. Below that, the map is noise. Seasonal or low-traffic pages may never build enough data to heatmap reliably.
Is Hotjar better than Microsoft Clarity?
For most stores, functionally no. Clarity is free at any traffic volume and covers the core heatmap and replay use cases. Hotjar's paid tiers add polish and integrations that matter at scale, but a founder starting out should install Clarity, use it properly, and upgrade only when there is a specific feature gap that is blocking a decision.
How many session replays should I watch before drawing a conclusion?
At least ten users matching the same pattern. Three replays of the same behaviour might be a signal or might be a coincidence. Ten gives you enough density to separate real friction from one-off user issues. If you cannot find ten replays of the same pattern, your sample is too small, or the problem is less common than you thought.
Can heatmaps tell me why my conversion rate dropped?
Not on their own. A heatmap can show you that click behaviour on a page has shifted, but it cannot tell you whether the shift caused the conversion drop or was itself caused by something else. For causal questions, pair the heatmap with session replays and with a before-and-after comparison in your analytics.
Do I need both tools, or is one enough to start?
Start with one tool that covers both. Hotjar and Clarity both do heatmaps and replays in a single product. Having a second tool is useful later if you outgrow the first one or need features it does not offer. Do not install multiple tools on day one. The overhead of configuring, tagging, and maintaining them will slow you down more than the extra data will help.
