Last updated:
A/B testing compares two versions of a single element to see which performs better. Multivariate testing changes multiple elements at once and measures every possible combination simultaneously. For almost every store under enterprise scale, A/B testing is the right default. Multivariate testing is a high-traffic specialist tool, not a step up.
The confusion between the two is one of the most expensive misunderstandings in CRO. Founders read that multivariate testing is "more advanced" and assume it produces better results. It does not. It produces nothing at all if your traffic is below the threshold to power it, which is the case for most stores that even consider running one.
Gabriel Weinberg and Lauren McCann's Super Thinking covers the statistical significance principles that determine whether either method actually works for the traffic level you have. The maths is unforgiving, and most founders do not run the numbers before committing.
In my work at Precision, the conversation about multivariate testing usually comes up at stores that should not be running either method yet. A store converting at 1.5% on 4,000 monthly visitors does not have the data to validate an A/B test, let alone an MVT with twelve combinations. The honest answer is to either drive more traffic, fix the obvious friction without testing, or wait until the volume is there.
This article covers what each method actually does, where each one wins, and how to know which one is appropriate for your store right now.
What is the difference between A/B testing and multivariate testing?
A/B testing splits traffic between two versions of a page that differ in exactly one element, and measures which version produces a better outcome on a defined goal. Multivariate testing splits traffic across every possible combination of multiple changing elements at the same time, and measures which combination performs best.
A/B testing is changing one ingredient in a recipe to see if the dish tastes better. Multivariate testing is changing five ingredients at once across twelve different combinations, then trying to figure out which one mattered. The first produces a usable answer. The second produces a winning combination you cannot trace back to a single cause. Both can be statistically valid. Only one of them teaches you something you can apply to the next dish.
For a fuller breakdown of how A/B testing works in practice, including how to design a test that produces a clear answer, the A/B testing guide for founders walks through hypothesis design and significance.
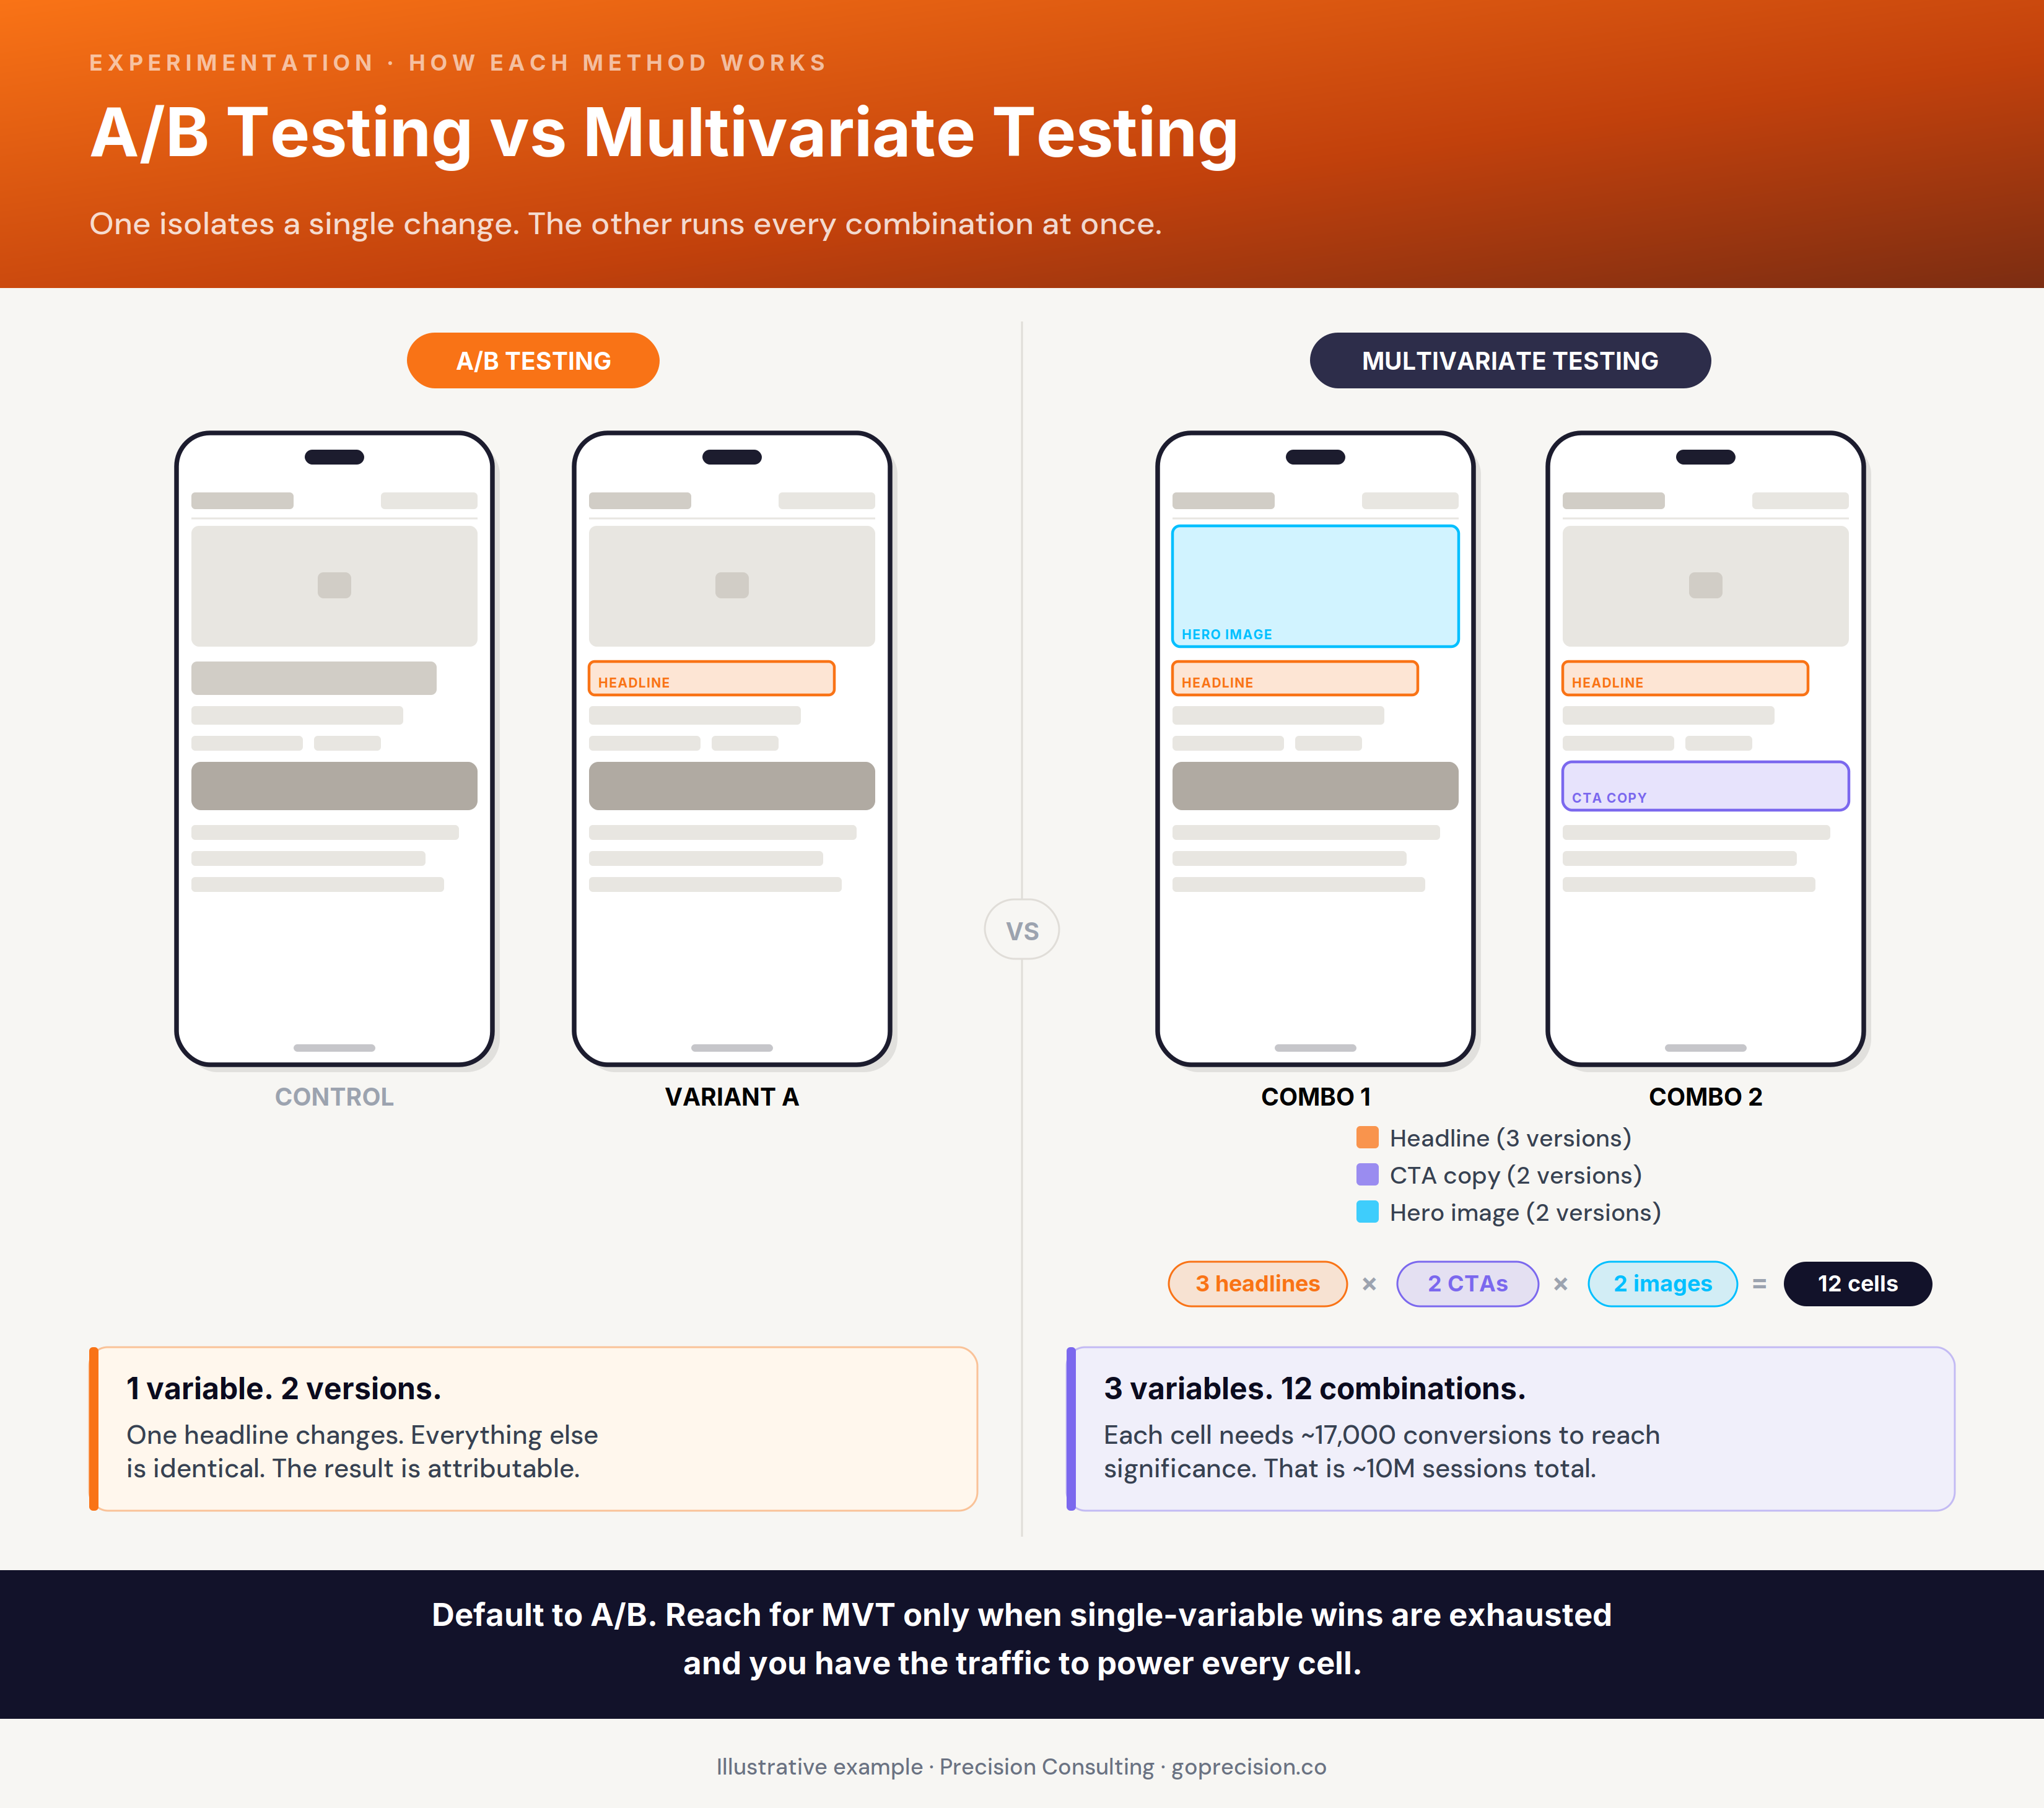
A/B isolates one change across two cells. Multivariate tests every combination of multiple changes across many cells. The traffic requirement multiplies, not adds.
One variable changes, the rest hold constant
The defining feature of an A/B test is isolation. You change exactly one element. Everything else stays identical between the control and the variant. When the test ends, the difference in outcomes is attributable to the one thing you changed. There is no ambiguity about which variable moved the metric. That clean attribution is what makes the result actionable.
Multivariate testing changes everything at once and isolates nothing
A multivariate test with three headline options, two CTA buttons, and two hero images creates twelve combinations. Each combination needs enough traffic to reach significance independently. When the test ends, you know which combination won. You do not know which of the three variables drove the result. The headline might be doing all the work. The CTA might be neutral. The image might be hurting. The design of the test does not let you separate them.
Why is A/B testing the default for most stores?
A/B testing is the default for most stores because it produces a clean, interpretable answer with the smallest amount of traffic and the lowest implementation complexity. You change one thing. You measure the outcome. You know whether the change worked. There is no ambiguity about which variable moved the metric.
A/B testing produces knowledge you can actually use
A win on an A/B test produces a piece of knowledge you can act on. The headline that worked tells you something about how your buyers respond to specificity, urgency, or framing. That insight informs the next test, the next page, and the next campaign. The learning compounds across your whole programme.
Multivariate testing does not produce that kind of insight at the same resolution. A winning combination tells you the combination won. It does not tell you why. You walk away with a deployed change and no understanding of which variable drove the outcome, which means you cannot apply the insight anywhere else.
A/B testing is faster to set up and harder to misinterpret
Most founders can read an A/B test result and act on it. Multivariate test outputs require statistical literacy that most stores do not have in-house, and reading them wrong is more common than reading them right. A confused operator reading a multivariate result is more likely to ship the wrong combination than a confident operator reading an A/B test is to ship the wrong variant. Tool complexity that exceeds team capacity is a tax that compounds across the year.
A/B testing teaches you about your buyers, not just about your page
The practical pattern I see most often is this. A store starts with A/B testing, runs ten or twelve tests in a year, learns what its buyers respond to, and lifts conversion measurably. Another store starts with multivariate testing, never reaches significance on most tests, gets confused by the ones that do, and gives up on testing within six months. The first path produces results. The second produces frustration.
When does multivariate testing actually make sense?
Multivariate testing makes sense when you have very high traffic, a stable conversion rate baseline, and a specific commercial reason to know which combination of multiple variables performs best together. Those three conditions almost always coexist at enterprise scale and rarely at growth-stage scale. If you are not at one of those conditions, multivariate testing will waste traffic without producing actionable results.
Microsoft's well-known Bing colour test, where the company tested 41 different shades of blue on the search results page, lifted ad revenue by tens of millions of dollars annually. The test was possible only because Bing handled enough daily searches to detect a sub-percentage-point lift on a single colour variation. That is the traffic profile that justifies multivariate testing. It is also a profile that fewer than a fraction of one per cent of e-commerce stores have.
You have very high traffic, not just high traffic
The traffic threshold for multivariate testing is the hardest one to meet. A multivariate test with eight or twelve cells needs each cell to reach the same conversion volume that a single A/B test cell would need to be significant. For a store converting at 2% with a 10% minimum detectable effect, that is roughly 17,000 conversions per cell at 95% confidence. Across twelve cells, that is over 200,000 conversions before the test ends. At a 2% conversion rate, you need ten million sessions of qualifying traffic to reach that volume in a reasonable timeframe.
Your bottleneck is interaction effects, not single-variable wins
Most pages on most stores are not optimised at the level of detail where the interaction between three variables is the question worth answering. The bigger lever is usually a single variable change. Multivariate testing earns its place when you have already exhausted the single-variable wins, and the remaining gains come from interaction effects, which is a late-stage problem.
Your team can read multivariate results without misinterpreting them
The output of a multivariate test is a matrix, not a single comparison. Reading it correctly requires understanding interaction effects, multiple-comparison corrections, and the difference between a main effect and an interaction. Most growth-stage stores do not have that statistical literacy in-house. Hiring it in for a single test rarely pays back. If you cannot read the result, the test is not yours to run.
What does the traffic and time math actually require?
The traffic math behind A/B and multivariate testing is unforgiving, and most founders do not run the numbers before committing. A reliable A/B test on a 2% conversion rate, looking for a 10% relative lift at 95% confidence, needs around 17,000 conversions per variant. That is roughly 850,000 sessions for a two-cell test. A four-cell multivariate test needs that volume per cell. A twelve-cell test needs twelve times that.
Evan Miller's sample size calculator, which most testing tools embed into their product UI, runs this maths in seconds. The reason most operators ignore it is not that the calculator is hard to use. It is that the answer is uncomfortable. A founder who calculates that their first test will take fourteen weeks to reach significance often shrinks the test rather than the timeline. Our best CRO tools guide covers the testing platforms that surface this calculation honestly, instead of letting you ship a "winner" your sample size never earned.
Why MVT requirements multiply, not double
The data requirement for a multivariate test does not double or triple as you add variables. It multiplies by the total number of cells. Three headlines times two CTAs times two images is twelve cells, not seven. Each cell needs the full A/B-test sample size to reach independent significance. The maths punishes complexity exponentially.
What to do when your traffic does not support either
The only honest way to test on lower traffic is to test bigger changes. A small headline tweak might need a 10% relative lift to be commercially worth running, which requires very large samples to detect. A complete restructure of the cart page might produce a 30 or 40% relative lift, which is detectable with a fraction of the traffic. Bigger changes, fewer of them, and accept that you cannot test minor copy variations until you have the volume to support them.
The conversion benchmarks by category help you anchor what your baseline conversion rate should be. The lower the baseline, the more traffic you need for any test to reach significance, and the more important it is to test changes large enough to be detectable.
This is the kind of analysis we run in a Precision Deep Dive Audit. If you want to see whether your traffic actually supports the tests you are planning, request your free audit and we will run the numbers with you.
Which mistakes waste both A/B and multivariate tests?
The common mistakes that waste A/B and multivariate tests are nearly always the same: ending tests too early, testing changes too small to detect, ignoring sample size requirements, and changing the test mid-flight. Each one produces a result that looks real on the dashboard and is, in fact, noise.
Dan Ariely's Predictably Irrational documents how readily the brain finds patterns in random data, especially when motivated to. The pressure to ship the win, free up the test slot, and move on is real. Operators read early-stopping noise as a signal because they want it to be one. The discipline to wait until the test is properly powered is what separates programmes that produce compounding lift from programmes that produce a graveyard of "wins" that did not stick.
You stopped the test too early
A test that looks like a 12% lift after seven days will often regress to flat by week four. A test that looks like a 6% drop on day six will often climb back to neutral or positive by week three. Founders see the early movement, declare a winner or kill the variant, and then wonder why their conversion rate has not moved at the end of the month. The early movement was rarely the signal. It was variance, and the test was stopped before the variance averaged out.
Experimentation rewards patience. It does not have time for fail-fast quotes. If you fail your variants out fast, you fail your chances at revenue growth even faster. You need the patience to wait out the full test window. You need to be able to stomach the slight dips that happen as customers adjust to a change. Not every lost order in week one is a loss.
I once ran an A/B test on distance-based delivery fees at a major delivery platform I worked with. In the initial weeks, we saw a loss of orders in certain distance buckets. On the surface, that reads as tragic. We were losing customers. When we looked at the data properly, we were only losing the orders we had been making losses on anyway. Over the next couple of weeks, enough customers entered the pool at the new pricing that the overall cost per order had gone down, and net contribution had gone up.
If I had listened to the panicked voices on day six, looking at a chart trending down and saying we needed to shut this down, the platform would have continued making the same losses on the same orders. But I had run my numbers before. I knew the customer patterns. I knew management's patterns. I had decks ready to walk leadership through the exact charts showing how customer behaviour evolves over a two- to three-week period after every pricing change, how the dip we were seeing was in line with the expected pattern, and that there was no cause for alarm. The test ran its full window. The change shipped. The losses on those orders went away.
Build your case before the test starts, not when the variance hits. Know what the dip should look like before the dip happens. Walking into a panicked stakeholder meeting on day six with no historical data is how good tests get killed. Walking in with the right deck is how you protect the result.
You tested a change too small to detect
A button colour change might produce a 1% relative lift in conversion, which is real but undetectable on the traffic most stores have. Testing it anyway burns the traffic without producing an answer. The fix is to test bigger changes that produce bigger effects, ones detectable within the sample size you can realistically generate.
The only time a button colour change is genuinely going to move revenue is when the CTA could barely be seen before, and you have actually made it visible. Going from a low-contrast grey to a high-contrast brand colour against a busy hero is a visibility fix, not a colour preference test, and that often does move the needle. Changing from blue to purple on a CTA that was already prominent is not. Test changes the buyer can actually feel, not changes that only the design team will notice.
You changed the test mid-flight
Adding a third variant. Tweaking the variant copy. Letting the test run on a sale day when buyer behaviour is fundamentally different. Each of these contaminates the result. Set the test up cleanly, do not touch it until it is done, and reset if the conditions change materially during the run.
How do you choose what to test first?
To choose what to test first, follow the money and follow the friction. Test the page or step where you are losing the most revenue, with the change most likely to fix the largest leak. The first three or four tests in a CRO programme should target the biggest, most diagnosable problems on the site, because those are the tests with the highest expected return.
The biggest leaks are almost always at the cart and checkout. According to Baymard Institute research, drop-off rates between cart and order completion average around 70% across e-commerce, and small improvements at this stage produce disproportionate revenue lift because the buyers are already high-intent. The second biggest leaks are usually on product pages, where buyers decide whether to add to cart or leave.
Test the biggest leak, not the easiest change
At a major food delivery platform I worked with, the first major test was a full restructure of the homepage layout, not a button tweak. It delivered +40% conversion. Big tests on diagnosed friction beat small tests on guessed friction every time. The temptation is to start small because small tests feel safer. They are not safer. They are slower, less informative, and more likely to produce no detectable effect.
Form a hypothesis before designing the test
Use your analytics to identify the step with the worst drop-off relative to category benchmarks. That is the test target. Then form a hypothesis about what is causing the drop-off. The hypothesis comes from session recordings, customer support tickets, or heatmaps, not from guessing. The CRO audit checklist walks through how to identify the friction points that are worth turning into tests first.
Tests with no hypothesis behind them are not tests. They are guesses with statistics attached. The hypothesis is what makes the result useful even when the test fails. A losing test on a clear hypothesis tells you something true about your buyers. A losing test on a guess tells you nothing.
Why does statistical significance break most CRO programmes?
Statistical significance is the rule that breaks most CRO programmes because it is the rule that founders most often ignore. A test that has not reached significance is not a result. It is a snapshot of variance. Calling a winner before the test is significant is the most common reason CRO programmes underperform their potential.
Statistical significance, in plain language, is a measure of how confident you can be that the difference between two variants is real and not the result of random variation. The standard threshold is 95%, meaning there is a 5% chance the result is noise even when the test passes. Below 95%, the chance of the result being noise rises sharply. Jacob Cohen's foundational work on Statistical Power Analysis for the Behavioral Sciences (1988) established the convention, and every major testing platform has built its winner-detection logic on the same principle.
You called the winner before significance
Every major testing tool calculates significance for you. The reason it gets ignored is that significance often arrives later than the founder wants. The pressure to ship the win, free up the test slot, and move on is real. The discipline to wait until the test is properly powered is what separates programmes that produce compounding lift from programmes that produce a graveyard of unverified wins.
Your test ran for less than one full business cycle
There is a related rule that matters more than most operators realise. Run tests for at least one full business cycle, not just until significance. A test that reaches significance on a Monday but ends before the next weekend includes only weekday traffic, which tends to convert differently from weekend traffic. The minimum honest test length for an e-commerce site is two weeks, regardless of what the significance calculator says, to account for full weekly behavioural cycles.
The cost of stopping a test early is not just the wrong answer. It is the cumulative drift across every test you run. Each early-stopped test has a higher probability of being noise. Across a year of testing, an undisciplined programme produces a "winning" stack of changes that, in aggregate, have moved nothing. The numbers on the dashboard look great. The conversion rate at the end of the year is identical to where it started.
Want help designing a testing programme that actually moves the metric? See how Precision works with e-commerce brands, or book a free strategy call and we will look at your traffic, your baseline, and the tests worth running first.
Gabriel Weinberg and Lauren McCann's Super Thinking is the clearest non-statistician's guide to the mental models behind significance, sample size, and base rates. Dan Ariely's Predictably Irrational covers the cognitive biases that make founders see signal in test noise. Jacob Cohen's Statistical Power Analysis for the Behavioral Sciences is the academic foundation behind why 95% became the default confidence threshold and why early stopping inflates your false-positive rate.
Key Takeaways
- A/B testing changes one element and measures which version performs better. Multivariate testing changes multiple elements at once and measures every possible combination.
- Precision's CRO programmes treat statistical significance as a non-negotiable. Tests that have not reached 95% confidence at two weeks are not winners, regardless of what the early dashboard suggests.
- A/B testing is the right default for almost every store because it produces a clean, actionable answer with the smallest sample size.
- Multivariate testing requires very high traffic, a stable baseline, and a specific reason to test interaction effects. Almost no growth-stage store meets those conditions.
- A reliable A/B test on a 2% conversion rate needs roughly 17,000 conversions per variant at 95% confidence. Multivariate tests require that volume per cell, often across eight to twelve cells.
- Experimentation rewards patience. Stopping a test on day six because the chart is dipping is how good tests get killed. Build the case and the historical context before the variance hits.
- Test changes the buyer can actually feel, not changes that only the design team will notice. A button colour change moves revenue only when it makes a previously invisible CTA visible.
- Test the biggest leaks first. Cart and checkout drop-off averages around 70% per Baymard Institute and offers the highest expected return on the first wave of tests.
- 95% confidence is the standard threshold. Two weeks is the minimum honest test length. Tests that fail either rule are noise dressed as wins.
Frequently Asked Questions
What is the difference between A/B testing and multivariate testing?
A/B testing compares two versions of a page that differ in exactly one element and measures which version performs better. Multivariate testing changes multiple elements at once and measures every possible combination of those changes. A/B testing produces a clean, single-variable answer. Multivariate testing produces a combination winner without isolating which individual variable drove the result.
When should I use multivariate testing instead of A/B testing?
Use multivariate testing only when you have very high traffic (typically millions of monthly sessions), a stable conversion rate baseline, and a specific commercial reason to know how multiple variables interact. For almost every store under enterprise scale, A/B testing produces more wins and more usable insight per unit of traffic.
How much traffic do I need to run A/B testing?
A reliable A/B test on a 2% conversion rate, looking for a 10% relative lift at 95% confidence, needs around 17,000 conversions per variant, or roughly 850,000 sessions for a two-cell test. Stores with less traffic should test bigger changes that produce larger detectable effects, rather than small variations that need huge samples to confirm.
Why do most multivariate tests fail?
Most multivariate tests fail because the store does not have the traffic volume to power each cell to statistical significance. A twelve-cell MVT needs twelve times the traffic of a two-cell A/B test. Founders end tests early to get a result, the result is noise, and the change either has no effect or hurts conversion when shipped.
How long should I run an A/B test?
Run A/B tests for at least two full weeks, regardless of when significance is reached, to capture full weekly behavioural cycles. Tests that hit significance in three days often regress to flat over the following weeks, because early significance is more often variance than a real effect. Two weeks at 95% confidence is the minimum honest standard.
What if my variant is dipping in the first week, should I shut it down?
Usually no. A dip in the first week of a test is often customers adjusting to a change, not a real loss. Pricing tests in particular show two- to three-week customer adjustment patterns before the steady state emerges. Build a historical view of how your customers respond to similar changes before the test starts, so you can tell the difference between an expected dip and a real loss when it matters.
What should I test first on my store?
Test the page or step where you are losing the most revenue. For most e-commerce stores, that is the cart or checkout, where drop-off averages around 70% per Baymard Institute. Form a hypothesis from session recordings, customer support tickets, or heatmaps before designing the test. Tests without a hypothesis produce results that cannot be acted on.
