Last updated:
The e-commerce conversion funnel is the path from first visit to completed purchase, and every stage of it loses buyers for a different reason. Most stores treat conversion as a traffic problem. More visitors, more sales. It rarely works that way.
If you're running ads and conversion is still flat, the answer isn't in the ads. It's somewhere between the landing page and the checkout, in a stage you probably haven't looked at closely enough. I've sat in enough sessions with founders who've spent months optimising their ad spend while their product page is losing 60% of the buyers who get there. The leak isn't loud. It doesn't send you an alert. It just quietly costs you revenue every single day while you look somewhere else.
At Precision, mapping the funnel stage by stage is the first thing we do in every diagnostic engagement. Most stores have a clear, fixable leak at one or two stages that has been quietly running for months. See how a diagnostic engagement works if you want to know exactly where your funnel is losing the most revenue.
Before getting into each stage, one thing worth saying clearly: the widely cited '2 to 3% is a good conversion rate' benchmark isn't useful without your category context. Fashion, consumables, and electronics have fundamentally different buying cycles and buyer behaviours. Comparing your store's CVR against a cross-category average is like comparing your sprint pace to a marathon average. The benchmark that matters is your own historical performance and the drop-off rate at each specific stage.
What the funnel actually looks like at each stage
Most founders think of the conversion funnel as: visitor arrives, views a product, adds to cart, checks out, purchases. Technically accurate. Practically useless. The real funnel has five distinct decision points, each with a different buyer state and a different emotional driver. And the buyer's question at each stage is completely different.
Stage one: the landing page or homepage. The buyer decides whether this store is worth five more seconds. Stage two: the product page. They decide whether this specific product is worth the risk of purchasing. Stage three: the cart. They decide whether to proceed or pause. Stage four: the checkout. They decide whether to complete the transaction right now. Stage five: post-purchase. They decide whether to come back.
Revenue isn't lost equally across these stages. For most stores, the biggest leaks are at stages two and four. That is where the highest-impact fixes live.
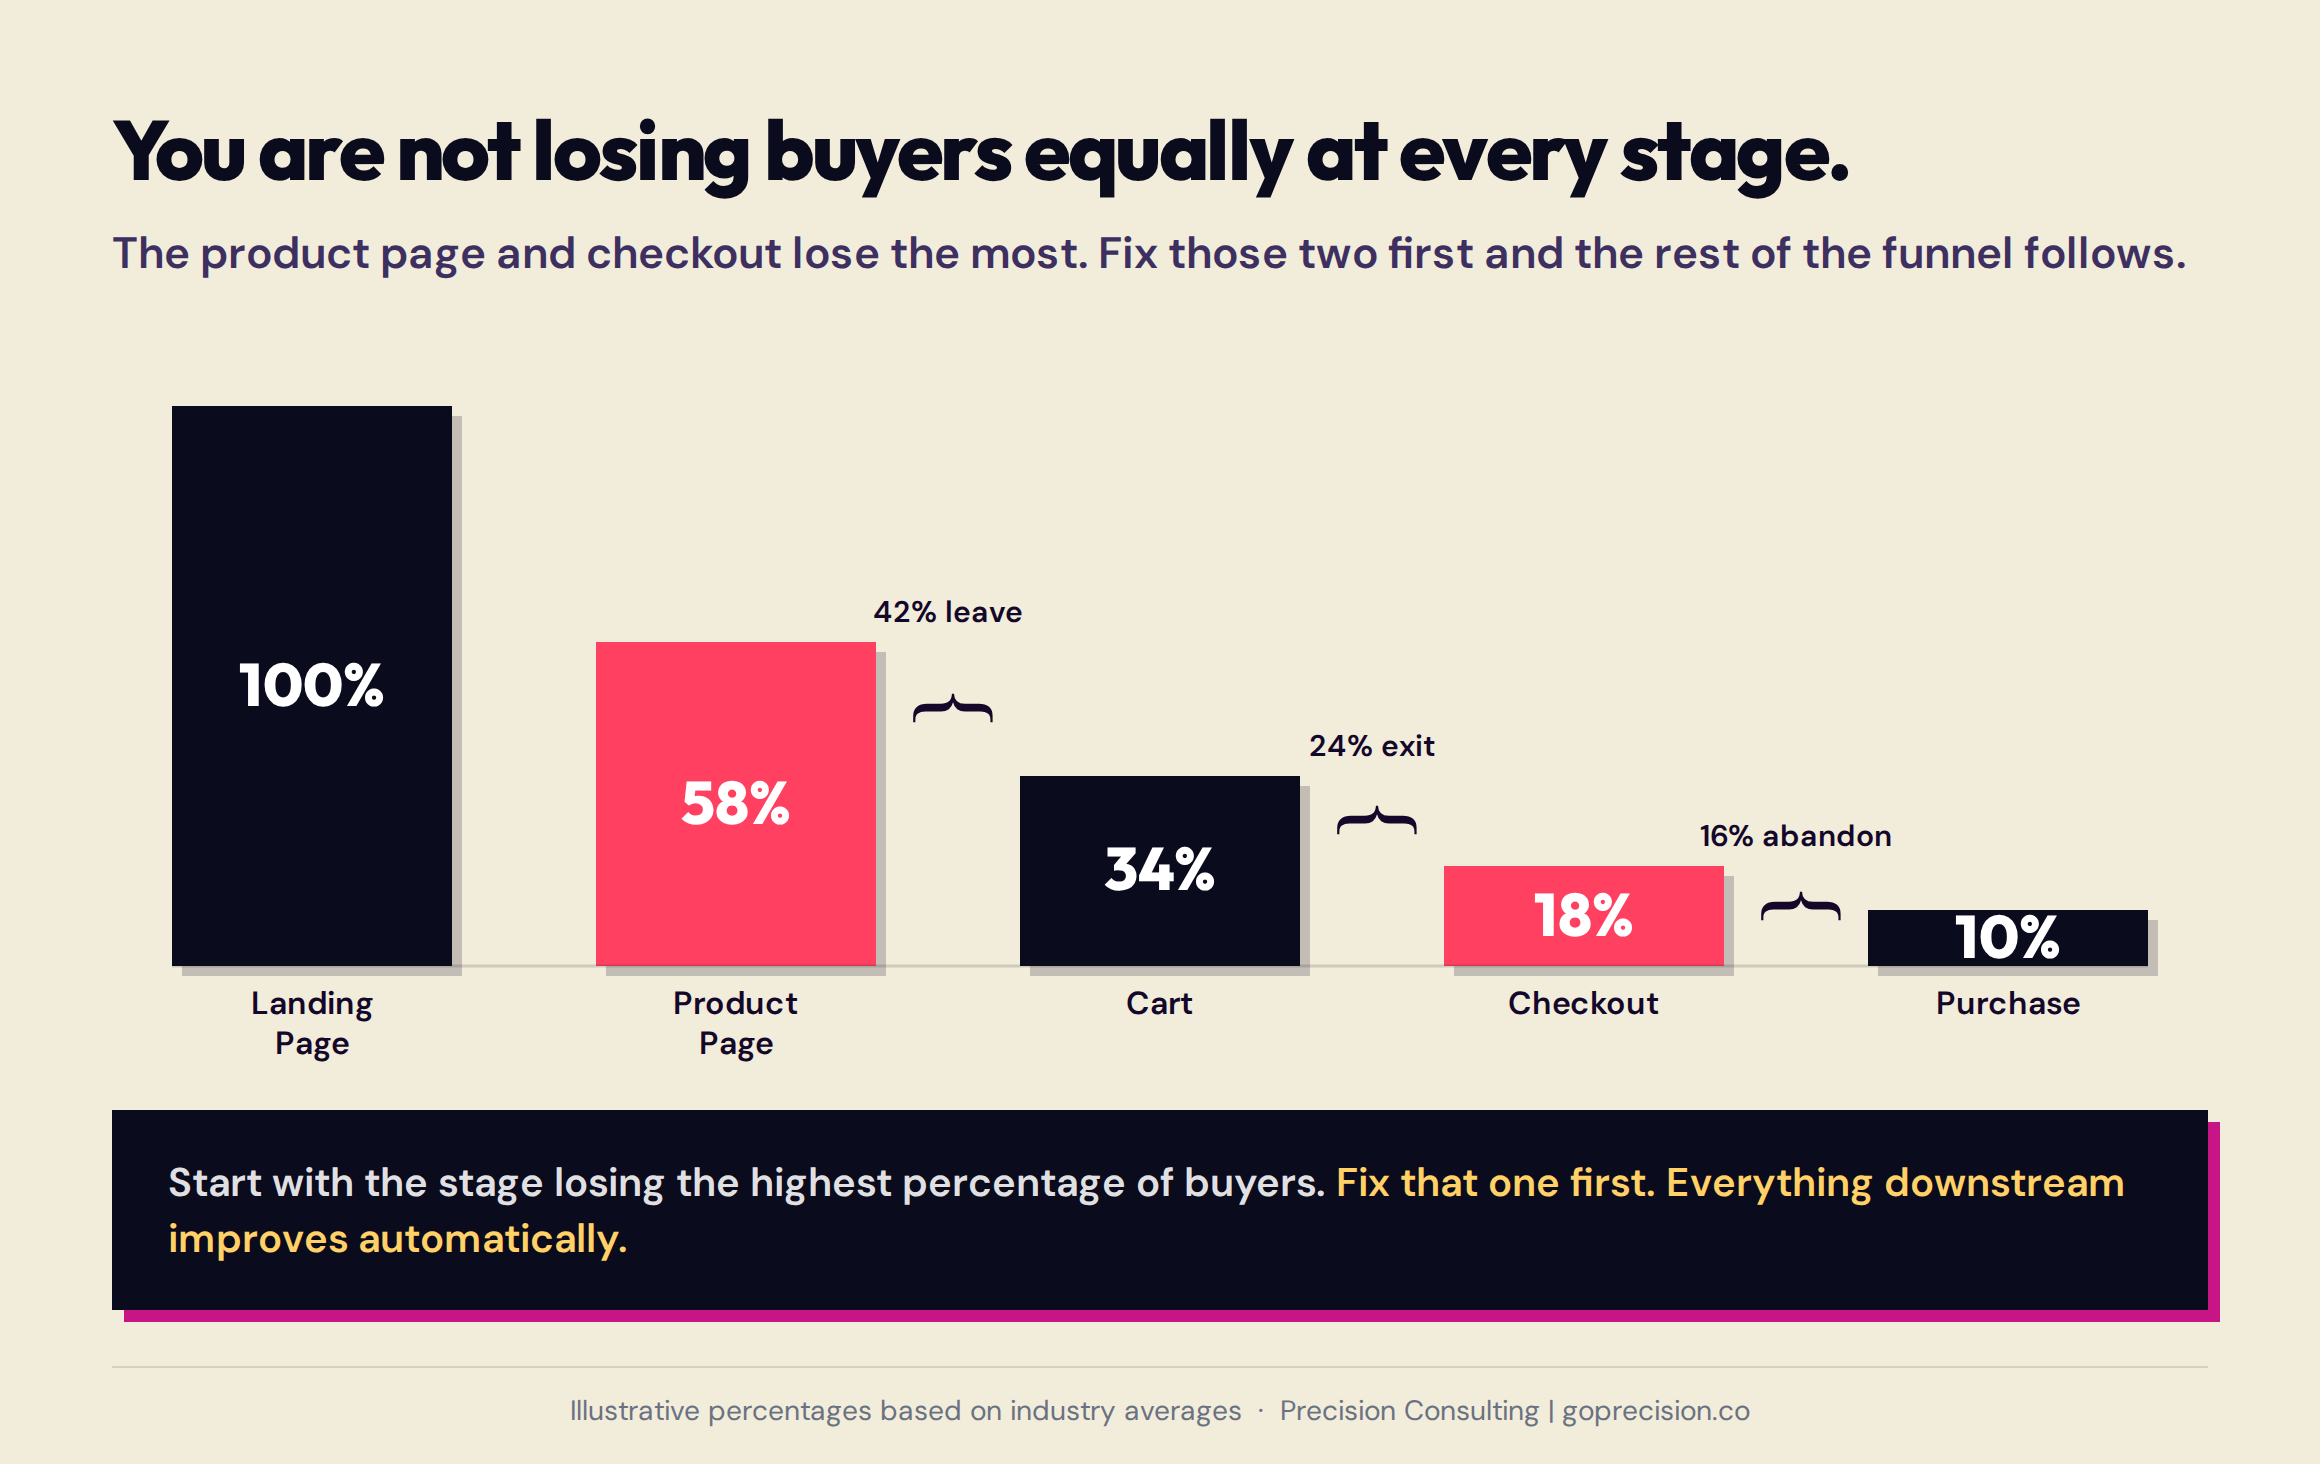
Five stages, five different buyer decisions. Most funnel analysis stops at the total drop-off number. The leverage is in understanding which stage is responsible for the most percentage loss, not just the most absolute volume.
Stage one: why visitors leave without viewing a single product
I've opened homepages during audits and immediately known why the bounce rate is 70%. Not because anything is technically broken. Because there's too much happening and none of it's saying anything. Two banners. A popup. Four different CTAs above the fold. Navigation with twelve categories. A visitor who arrives and immediately bounces hasn't rejected your products. They've decided this store is going to be hard work. That judgment takes about three seconds.
The most common causes of early bounce are slow load time, a homepage that doesn't clearly communicate what the store sells and why it's worth buying from, and a visual hierarchy that makes the visitor work too hard to find what they came for. If your bounce rate is above 60%, you're spending money to send buyers to a page that's losing them before they've seen a single product. That's where to start.
Load time is a conversion problem, not a technical problem.
A one-second delay in page load reduces conversion by roughly 7%, based on data from Akamai. Think about that at scale. If your store converts 200 sales a month, a two-second slowdown is costing you around 25 sales before a single visitor has seen your products. On mobile it's worse. Buyers on their phones are less patient than on desktop and more likely to abandon a slow page mid-load. Compressing images, switching to WebP format, and removing unused theme scripts are configuration decisions any store owner can make without development.
The three-second clarity problem
The three-second test is blunt and useful. Load your homepage, cover it after three seconds, and write down what you remember. Most founders are surprised by how little registers. If the primary product category, the value proposition, and the main CTA don't survive three seconds of exposure, they're not doing their job. Visitors don't read pages. They scan for the signal that tells them whether to stay.
Stage two: why buyers leave your product page without adding to cart
Your product page is doing the heaviest lifting in your entire store. A visitor who's landed there has already said yes to your store. The only question left is whether they're going to say yes to this product. Most founders spend their time optimising the wrong things on this page. They test headline copy and button colours while the actual conversion killers — missing social proof, a buried returns policy, and risk signals that outweigh trust signals — sit untouched. That's where buyers are leaving. And it's fixable.
Risk is the operative word. Not quality. Not price. Regret. Two buyers land on the same product page. One sees 340 reviews, a clear returns policy near the add-to-cart button, and specific photos that answer the questions they have. They buy. The other sees 6 reviews, no returns information visible without scrolling, and photos that leave the key question unanswered. They don't. Same product. Same price. Completely different experience of the same page. Every element on your product page either reduces the chance a buyer will regret purchasing, or gives them another reason to hesitate.
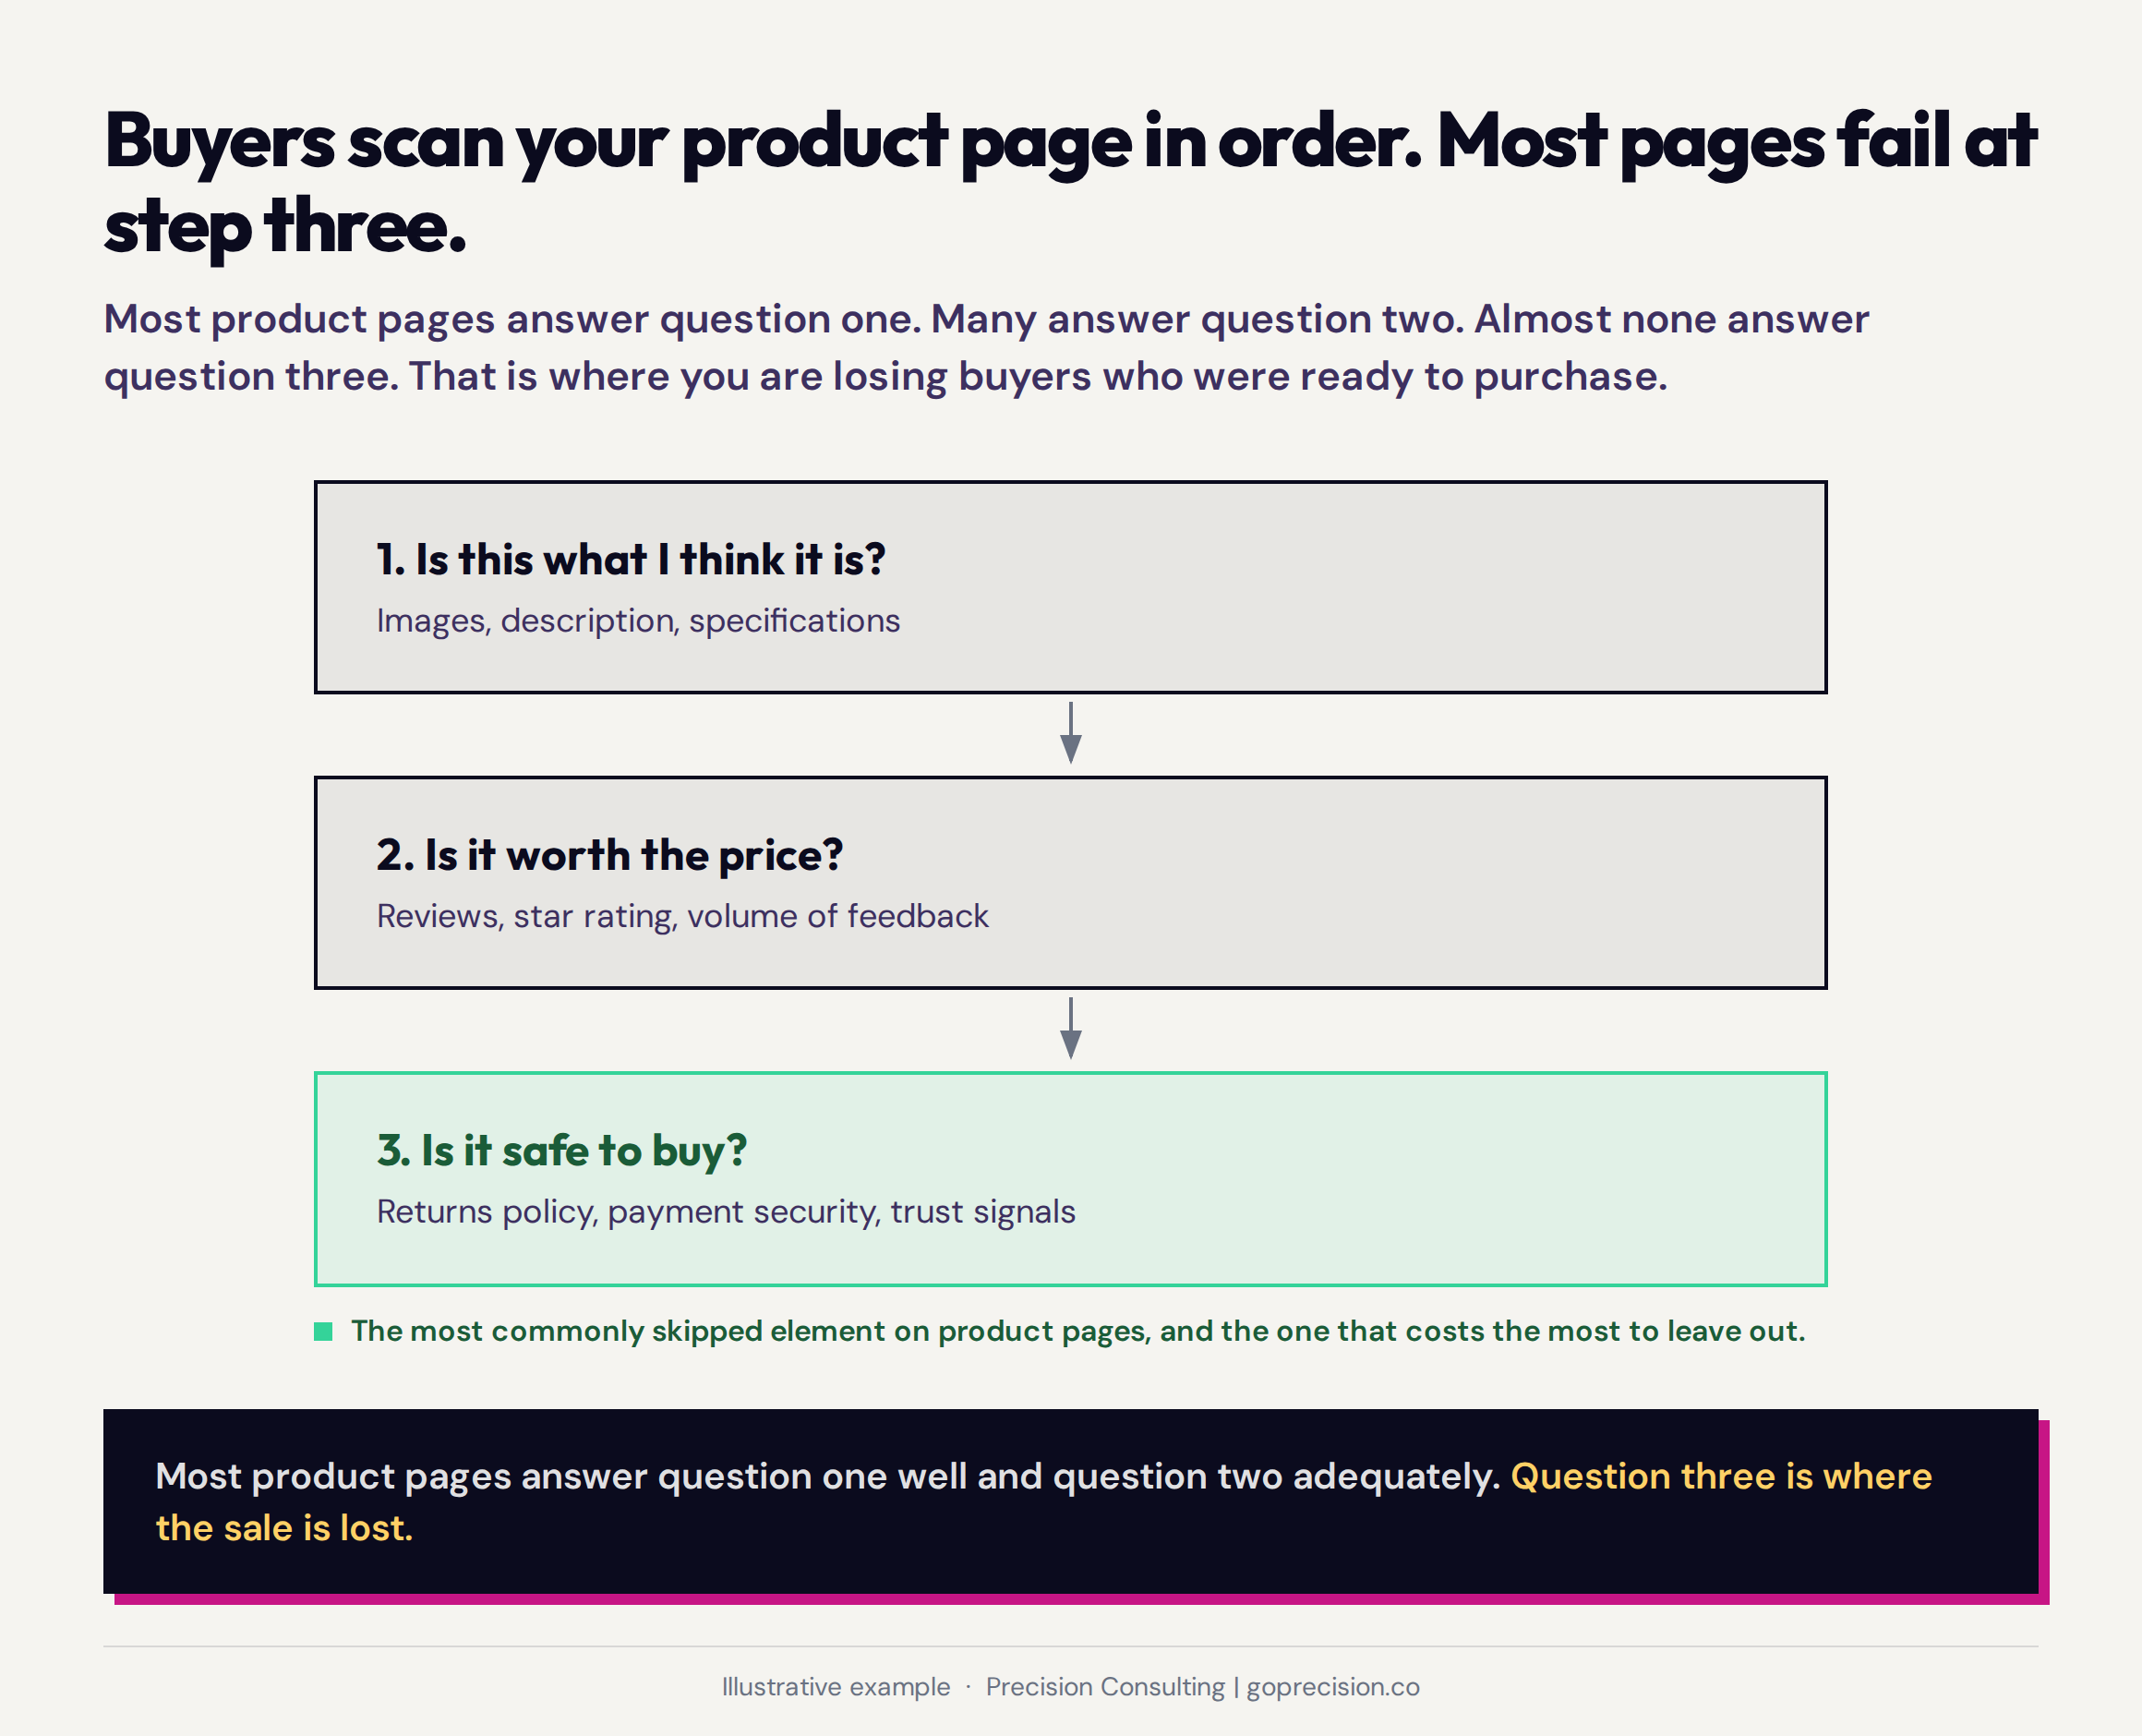
Trust elements on a product page are not equal in their conversion impact. Review volume, returns policy visibility, and image specificity sit at the top of the hierarchy. Fixing the bottom of this list while the top is broken is where most optimisation time is wasted.
Why review volume matters as much as review rating
Reviews are the most under-optimised element on most product pages. Because the ones that are there are too few, too generic, or buried so far below the fold that the buyer has already made up their mind before they reach them. A product with 4.8 stars and 12 reviews converts differently from a product with 4.8 stars and 1,200 reviews, even when the rating is identical. Volume signals safety in a way that a high average score can't replicate on its own.
Cialdini's research on social proof shows that people look to what others are doing to determine the correct course of action, particularly when they're uncertain. Uncertainty is the default state on a product page for a first-time visitor. The buyer doesn't know this brand, hasn't touched the product, and can't fully verify quality from photography. Reviews are the primary mechanism by which that uncertainty is resolved. A single glowing review looks curated. Forty consistent reviews across different buyers look like evidence. If your product has fewer than twenty reviews showing above the fold, you're asking buyers to make a decision without the social signal they're looking for. They won't tell you that's why they left. They'll just leave.
The returns policy as a conversion element
Most stores treat their returns policy as a legal document. Buyers treat it as a risk calculator. Before clicking add to cart, a meaningful percentage of buyers navigate to the returns page. What they find either resolves their doubt or compounds it. A policy written as conditions signals that returning is the buyer's problem. A policy written as a commitment signals the opposite. Read yours right now as if you've never seen it before. If it reads like a legal document protecting you from your customers, it's costing you sales you can't see.
Stage three: why buyers add to cart and never check out
Seven in ten buyers who add something to cart don't complete the purchase. That's the Baymard Institute figure, and in my experience auditing cart flows, it's accurate. What surprises founders when I show them their own data isn't the number. It's what's causing it. Most assume it's price sensitivity or distraction. It's almost always one of two things: a cost the buyer wasn't expecting, or too many decisions at the exact moment they were ready to stop thinking and just pay.
The two most common causes are unexpected costs and choice overload. Unexpected costs mean shipping charges, taxes, or fees appearing for the first time at the cart stage. Choice overload means the cart is introducing too many decisions at the moment the buyer is ready to act.
Why unexpected costs feel worse than their amount
Dan Ariely's research on arbitrary coherence shows that the first price a buyer encounters becomes the reference point against which subsequent prices are judged. A buyer who sees '$34' on the product page builds a mental model around that number. When '$34 + $8.99 shipping' appears at the cart stage, the shipping charge doesn't feel like $8.99 in isolation. It feels like a revision of the deal they thought they had. The discomfort isn't proportionate to the amount. It is proportionate to the gap between expectation and reality.
This is why surfacing the full order total, including shipping, as early as possible reduces abandonment at the cart stage. The number doesn't change. The surprise does. Show buyers what they'll pay before they get to the cart, and you'll lose fewer of them at the cart.
The choice overload problem in cart design
Sheena Iyengar's research on choice overload shows that beyond a certain point, more options reduce the likelihood of any decision being made. You've probably experienced this. You open a menu at a restaurant you've never been to; it has ninety items, and you spend ten minutes deciding and feel worse about your choice than you would have with fifteen options. A cart page that introduces upsells, bundle upgrades, and related products the moment a buyer is ready to pay is doing the same thing. The buyer came to pay. Let them.
Stage four: why buyers start checkout and abandon before paying
These are the buyers who sting the most to lose. They've given you their name. Maybe their email. They've seen the final price, and they haven't left. They've started. And then something in the checkout lost them. It's like a customer who's queuing at the till, gets to the front, and walks out because the card reader asked them to create a loyalty account before they're allowed to tap. That's checkout abandonment. It's not a price problem. It's a process problem.
Baymard Institute research across thousands of checkouts identifies the leading causes: being forced to create an account, a checkout process that feels longer or more complex than expected, concerns about payment security, and a checkout experience that doesn't feel trustworthy enough to hand over card details. Each is fixable without platform migration.
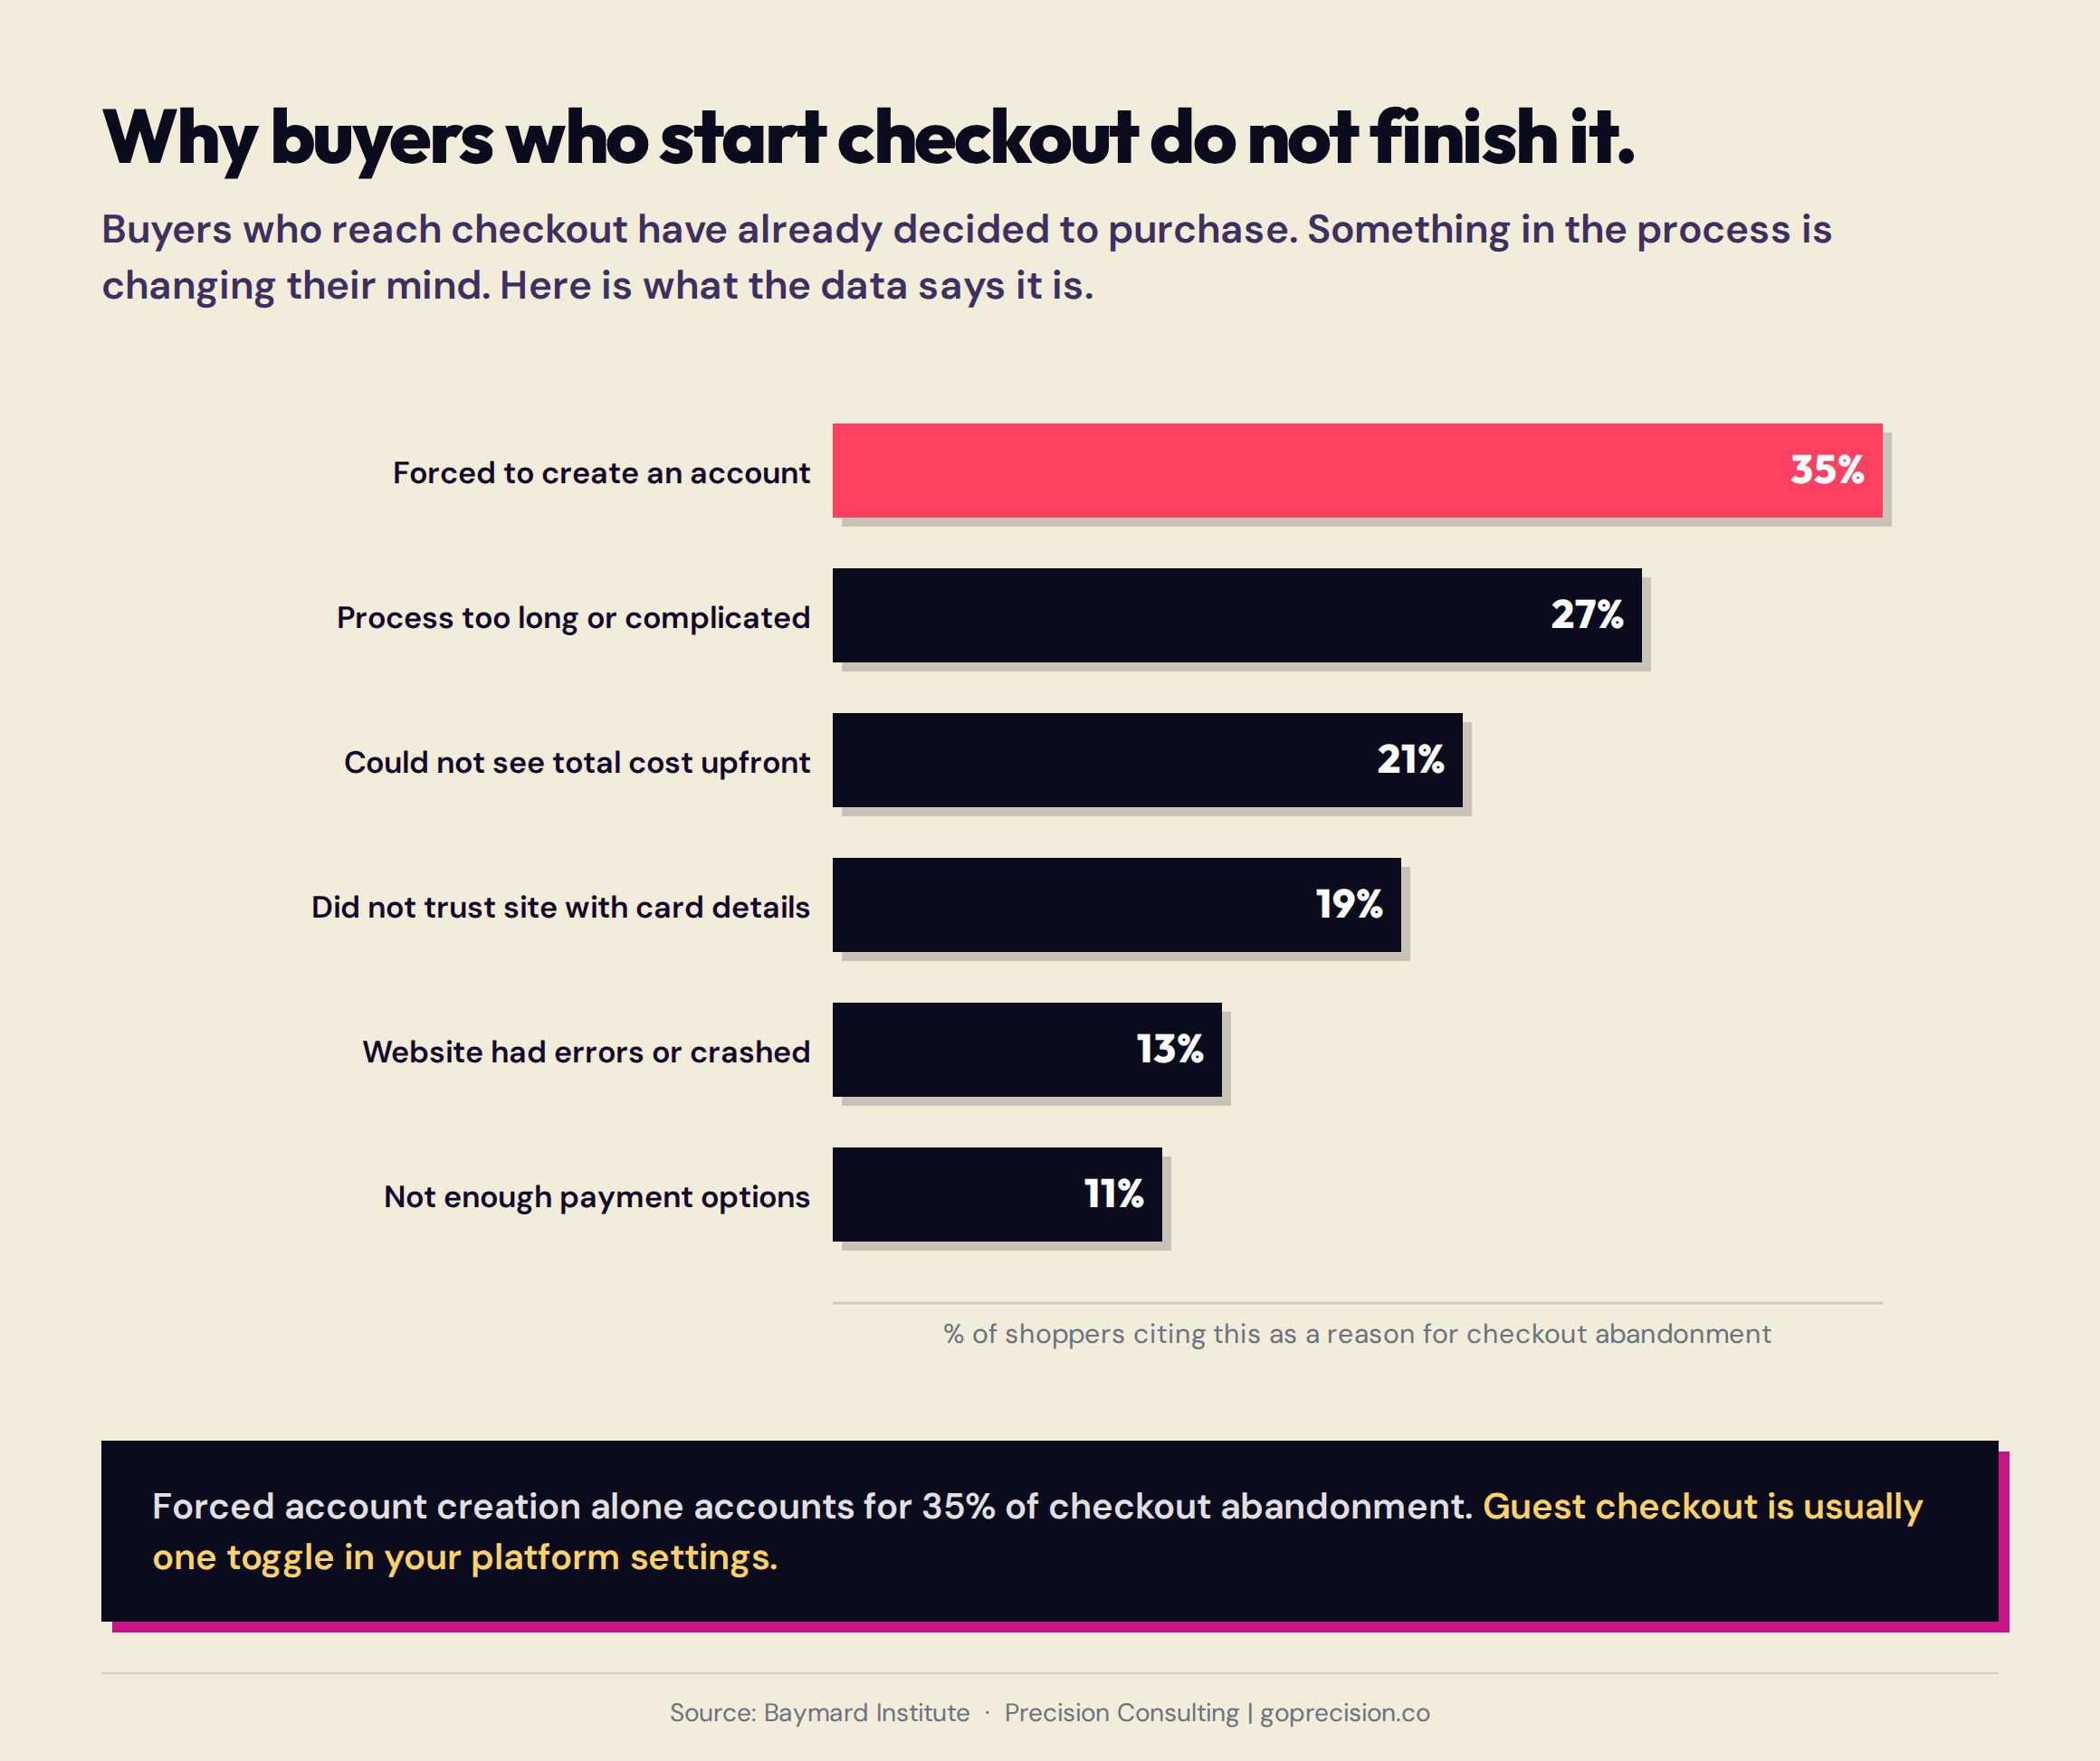
Checkout abandonment is not primarily a price problem. The leading causes are process problems: forced account creation, unexpected complexity, and trust gaps that appear after a buyer has already decided to purchase. Each is fixable independently.
The account creation mistake
Forcing account creation before purchase is the single highest-impact checkout error in most stores. It persists because it looks like a retention feature. More accounts means more customer data, more email subscribers, more repeat purchase potential. That logic is correct. The timing is wrong. A buyer who hasn't completed a transaction yet has no loyalty to trade on. Asking for commitment before value has been delivered is the wrong order. Go and check yours now. If a buyer can't get through your checkout without creating an account, you're losing a meaningful percentage of the people who were ready to pay. It's usually one toggle in your platform settings. Guest checkout, or a checkout that captures email upfront and offers account creation post-purchase as a convenience, consistently outperforms forced account creation in completion rate.
Progress indicators reduce abandonment not by shortening checkout but by making the end visible.
Most checkout abandonment attributed to 'too many steps' isn't actually about the number of steps. It is about the number of unexpected steps. A three-page checkout where the buyer can see 'step two of three' outperforms a single-page checkout that keeps revealing new fields as they scroll. The progress indicator activates what psychologists call the goal-gradient effect: effort and motivation both increase as people approach a visible finish line.
Stage five: why post-purchase experience determines whether they come back
Most founders think the funnel ends at purchase. It doesn't. The moment a buyer pays, a new anxiety starts. Did I make the right call? Will it look like the photos? What happens if I need to return it? That window, the 24 to 48 hours after payment, is when buyer's remorse peaks. And what your store does in that window determines whether they ever come back.
Buyer's remorse peaks in the period immediately after a discretionary purchase. A post-purchase email that confirms the order clearly, sets specific delivery expectations, and makes the returns process feel uncomplicated directly reduces the intensity of that regret and increases the probability of a repeat purchase. A generic automated confirmation that arrives hours later does none of this.
The economics of the second purchase
Think of it like this: your post-purchase email is the last thing a customer hears from you before they decide whether you're a store they'll return to. Most stores use that moment to say 'your order has been placed'. That's like a restaurant sending you a text that says 'you ate here'. It confirms the transaction. It does nothing else. It doesn't reduce the anxiety; it doesn't make the returns process feel easy; it doesn't give the customer any reason to come back. The data is consistent across most categories: a customer who buys twice has lifetime value three to five times that of a one-time buyer. Your post-purchase email is the cheapest lever you have for closing that gap. Most stores aren't pulling it.
A post-purchase sequence that does three things well covers the majority of the opportunity: confirm the order immediately and specifically, set a delivery expectation with a real date or tight range, and make the returns process feel easy rather than bureaucratic. That sequence, followed by a review request seven to ten days post-delivery, captures most of the retention and social proof opportunity that most stores leave unrealised.
How to read your own funnel data
Before you apply any of the fixes above, pull your funnel data. There's a wrong instinct that most founders follow here, and it's understandable: they look for where the most buyers are leaving and fix that first. But the stage losing the most buyers in absolute numbers isn't necessarily the stage with the worst problem. A stage that loses 15% of buyers but sits late in a high-volume funnel looks more alarming than a stage that loses 60% of buyers earlier. Fix the 60% first. Everything downstream improves automatically.
The stage with the highest drop-off percentage is where to start, not the stage with the highest absolute number of lost buyers. Losing 60% of buyers at the product page is more significant than losing 20% at checkout, even if the absolute number at checkout is larger, because the product page problem affects every buyer who reaches it. The stage with the highest drop-off rate is where to start. Not the most visible stage. Not the one that felt broken last week. The one where the data shows the biggest percentage of buyers walking away.
Three metrics beyond the funnel report give you sharper diagnostic precision. Add-to-cart rate, the percentage of product page views resulting in an add to cart, tells you whether the product page is working. Cart abandonment rate tells you whether the cart-to-checkout transition is working. Checkout completion rate tells you whether the checkout itself is working. These three numbers, read against your own historical performance and against category-specific benchmarks, show you exactly where to direct optimisation time.
- The e-commerce conversion funnel has five stages, each with a different buyer state and a different dominant cause of drop-off. The stage to optimise first is the one with the highest drop-off rate, not the highest absolute number of lost buyers.
- Stage one drop-off is most often caused by slow load time and a homepage that fails the three-second clarity test. Both are fixable without development.
- Stage two drop-off is most often caused by insufficient social proof, a missing or unclear returns policy, and risk signals that are louder than trust signals. Review volume matters as much as review rating.
- Stage three drop-off is most often caused by unexpected costs appearing at the cart stage and choice overload introduced at the moment the buyer was ready to act. Surface the full cost early and simplify the cart page.
- Stage four drop-off is most often caused by forced account creation, an unclear progress structure, and unnecessary form fields. Enabling guest checkout is consistently the greatest single-impact change available.
- Stage five determines repeat revenue. A post-purchase sequence that confirms specifically, sets real delivery expectations, and makes returns feel easy is the most cost-effective retention mechanism available to most stores.
- '2 to 3% is a good conversion rate' isn't a useful benchmark without your category context. The benchmark that matters is your own historical performance at each funnel stage.
Don't Make Me Think by Steve Krug is the essential reference for usability in digital interfaces and applies directly to stages one through four of the e-commerce funnel.
Influence by Robert Cialdini covers the psychology behind buying decisions, including social proof, commitment, and scarcity.
Predictably Irrational by Dan Ariely examines how irrational but predictable patterns shape economic decisions.
Frequently asked questions
What is a conversion funnel in e-commerce?
An e-commerce conversion funnel is the path a visitor takes from arriving at a store to completing a purchase. It has five distinct stages: the landing page, the product page, the cart, the checkout, and the post-purchase experience. Buyers leave at each stage for different reasons. Understanding which stage is losing the most buyers, as a percentage of those who reached it, is the starting point for effective conversion optimisation.
What causes high cart abandonment rates?
Cart abandonment averages around 70% across e-commerce. The most common causes are unexpected costs appearing at the cart stage for the first time, a cart page that doesn't resolve residual buyer doubt, and choice overload introduced by upsells and options at the moment the buyer was ready to proceed. The fastest fixes are surfacing the full order total, including shipping, earlier in the journey, adding a returns summary near the checkout button, and simplifying the cart page.
Why does forced account creation hurt checkout completion?
Forcing account creation before purchase introduces a barrier at the moment of highest buyer intent. The customer has already decided to purchase and is now being asked to sign up for something before they're allowed to proceed. Guest checkout, or a post-purchase account creation prompt after the transaction is complete, consistently outperforms forced account creation in checkout completion rate.
How does page speed affect e-commerce conversion?
A one-second delay in page load time reduces conversion by approximately 7%, based on Akamai data. On mobile, buyer tolerance is lower. Page speed improvements through image compression, modern image formats like WebP, and removal of unused scripts affect conversion at the very top of the funnel, before any buyer has seen a product.
What is a good add-to-cart rate?
Add-to-cart rates vary significantly by category, traffic source, and product type. As a broad reference point, an add-to-cart rate above 8 to 10% is generally healthy for a well-configured product page driving relevant traffic. If your add-to-cart rate is significantly below that, the priority is the product page: social proof volume, returns policy visibility, and image quality. If your add-to-cart rate is healthy but checkout completion is low, the problem is downstream.
Does the post-purchase experience affect future conversion rates?
Yes, significantly. A customer who makes a second purchase has a lifetime value three to five times that of a single-purchase customer. The post-purchase experience, specifically whether it reduces buyer's remorse, sets accurate delivery expectations, and makes returns feel easy, is the primary driver of whether a first-time buyer returns. A review request timed to fire after confirmed delivery captures substantially more reviews than the default timing in most platforms.
If you want to know exactly which stage of your funnel is creating the biggest revenue leak and what to fix first, our CRO services include a stage-by-stage funnel audit as part of every diagnostic engagement. We look at where buyers are dropping off at each stage, what's causing it, and where the data points for starting.