Last updated:
Reading e-commerce analytics means understanding five numbers that, together, tell you almost everything about where your store is losing revenue: conversion rate, add-to-cart rate, checkout initiation rate, cart abandonment rate, and revenue per session. You do not need a data science background to find these, interpret them, or act on them. You need to know where to look and what each number is actually telling you.
Most founders either avoid their analytics entirely because the dashboards feel overwhelming, or they monitor the wrong things: traffic, revenue totals, and sessions. These are outcome metrics. They tell you what happened but not why. The five metrics above are diagnostic metrics. They tell you that somewhere in the journey from arrival to purchase something is breaking.
Think of them like a car dashboard. A dashboard does not exist to show you gauges for their own sake. It exists to tell you what is wrong before you break down. A mechanic does not say, 'It seems slow.' They read the instruments, find the specific reading that is out of range, and trace it to a cause. That is what these five metrics do for your store.
These five metrics are also the starting point for every Precision engagement. If you want to see how we use them to diagnose where a store is leaking revenue, see how Precision works.
Why are most e-commerce analytics dashboards confusing?
Analytics platforms are built for breadth, not clarity. Shopify Analytics alone has dozens of reports. GA4 has hundreds of dimensions and metrics available. The natural response to that volume of data is to land on the numbers that are easiest to find: total revenue, total sessions, total orders.
The problem with those numbers is that they do not tell you what to do. If revenue is down, it could be because traffic is down, because conversion is down, because AOV is down, or because the repeat purchase rate has fallen. Without knowing which lever moved, you cannot know which one to pull.
The five metrics in this article are diagnostic. They isolate different parts of the customer journey so that when something breaks, you can see exactly where. They are not a progress report. They are a fault-finding tool.
Which five e-commerce analytics metrics matter most?
1. Conversion rate
Conversion rate is the percentage of sessions that result in a purchase. A store with 20,000 monthly sessions and 300 orders has a conversion rate of 1.5%. This is the headline diagnostic number, and it is the one most founders watch most closely while understanding it least.
The number most people think of as conversion rate is actually the end-to-end session-to-purchase rate. But within your funnel, every step has its own conversion rate, and those page-level rates are where the real diagnostic value lives. The rate at which visitors move from a collection page to a product page, from a product page to the cart, from the cart to checkout initiation: these micro-conversion rates map exactly where your funnel is leaking. A 1.5% overall conversion rate can be hiding a 40% drop-off between your product page and add-to-cart that your headline number will never surface on its own.
For most e-commerce categories, a healthy end-to-end conversion rate sits between 1.5% and 3.5%, with variation by category, price point, and traffic quality. Fashion and apparel typically benchmark lower than health and beauty. Higher-consideration purchases convert lower than commodities.
In Shopify, go to Analytics > Reports > Online Store > Conversion rate. In GA4 with e-commerce tracking enabled, it appears in Reports > Monetisation > Overview as 'Purchase conversion rate'. Compare against your own historical baseline first, category benchmarks second.
In Shopify, set the date range to the last 90 days and compare against the same period last year. The comparison tells you whether conversion is trending in the right direction, independent of traffic changes. The funnel view directly below shows you where in the session-to-purchase journey the biggest drop-off is occurring.
2. Add-to-cart rate
Add-to-cart rate is the percentage of sessions where a visitor adds at least one item to their cart. It measures how effectively your product pages are converting browsers at the first real decision point in the funnel.
A store with a low add-to-cart rate has a product page problem. The visitor arrived, looked at the product, and left without committing. The most common causes are unclear photography, insufficient product information, a price that does not feel justified by what the page is communicating, or a mobile layout where the add-to-cart button is hard to find or too far below the fold.
The benchmark figure most commonly cited is 8% to 10% for a healthy product page, and below 5% on a consistently trafficked page as a signal to investigate. Treat those numbers carefully. Add-to-cart rate varies significantly by category and by how high-consideration your purchase is. A furniture store and a supplement brand will look very different against the same benchmark. Before you decide you are underperforming or outperforming, look at benchmarks specific to your category, not the market average.
In Shopify, the add-to-cart rate appears in Online Store > Conversion rate funnel as 'Added to cart'. In GA4, it is an event metric under Monetisation.
Pull the add-to-cart rate by individual product in Shopify under Analytics > Reports > Products > Product performance. Sort by sessions to find your highest-traffic products and check their rates individually. A product with 500 monthly sessions and a 3% add-to-cart rate is a higher priority than one with 50 sessions and the same rate.
3. Checkout initiation rate
The checkout initiation rate is the percentage of sessions where a visitor starts the checkout process. It tells you whether people who have already decided to buy are making it through to checkout, or whether something about the cart experience is stopping them.
A large gap between the add-to-cart rate and checkout initiation rate is a cart problem. The buyer added an item, expressed clear intent, and then did not start checkout. The most consistent causes are unexpected shipping costs surfaced at the cart, a cluttered or slow cart layout, missing trust signals, or a promotional code field that sends people away to search for a discount they will not find.
In Shopify Analytics, it appears in the Conversion rate funnel as 'Reached checkout'. In GA4, look for the begin_checkout event in your e-commerce reports.
The promotional code field is one of the most consistent causes of cart-to-checkout drop-off. A buyer who sees the field assumes a code exists and leaves to find one. They often do not come back. Consider removing the field entirely, collapsing it behind a link, or pre-filling it where applicable.
4. Cart abandonment rate
Cart abandonment rate is the percentage of checkout sessions started but not completed. A store where 100 sessions reach checkout and 60 complete it has a cart abandonment rate of 40%.
According to the Baymard Institute, the average documented cart abandonment rate across e-commerce is approximately 70%. Every store has checkout abandonment. The question is whether your rate is materially higher than your category average, and which specific checkout step is losing the most buyers. The step with the largest drop-off is where you start, not the checkout as a whole. The most common documented reasons for cart abandonment come down to unexpected costs, forced account creation, and payment friction.
In Shopify, the checkout funnel is visible under Analytics > Reports > Checkout. In GA4, funnel exploration reports let you build a step-by-step view of progression through checkout.
In Shopify, look at the percentage of sessions dropping off between each checkout step. The account creation prompt, the shipping cost reveal, and the payment information step are the most common culprits. The one with the largest single drop-off gets investigated first.
5. Revenue per session
Revenue per session is total revenue divided by total sessions. It captures conversion rate, average order value, and traffic quality in one number, and it is the single most useful headline metric for tracking overall store performance over time.
Where conversion rate tells you how many people are buying, and AOV tells you how much they spend, revenue per session combines both into a measure of how much value your store extracts from each visitor. A store moving from $1.20 to $1.80 revenue per session over six months has improved materially, regardless of what happened to traffic volume.
This metric is also the most honest measure of CRO progress. When you track it alongside your testing programme over time, the compound effect of each improvement becomes visible in a way that individual metric movements do not always show.
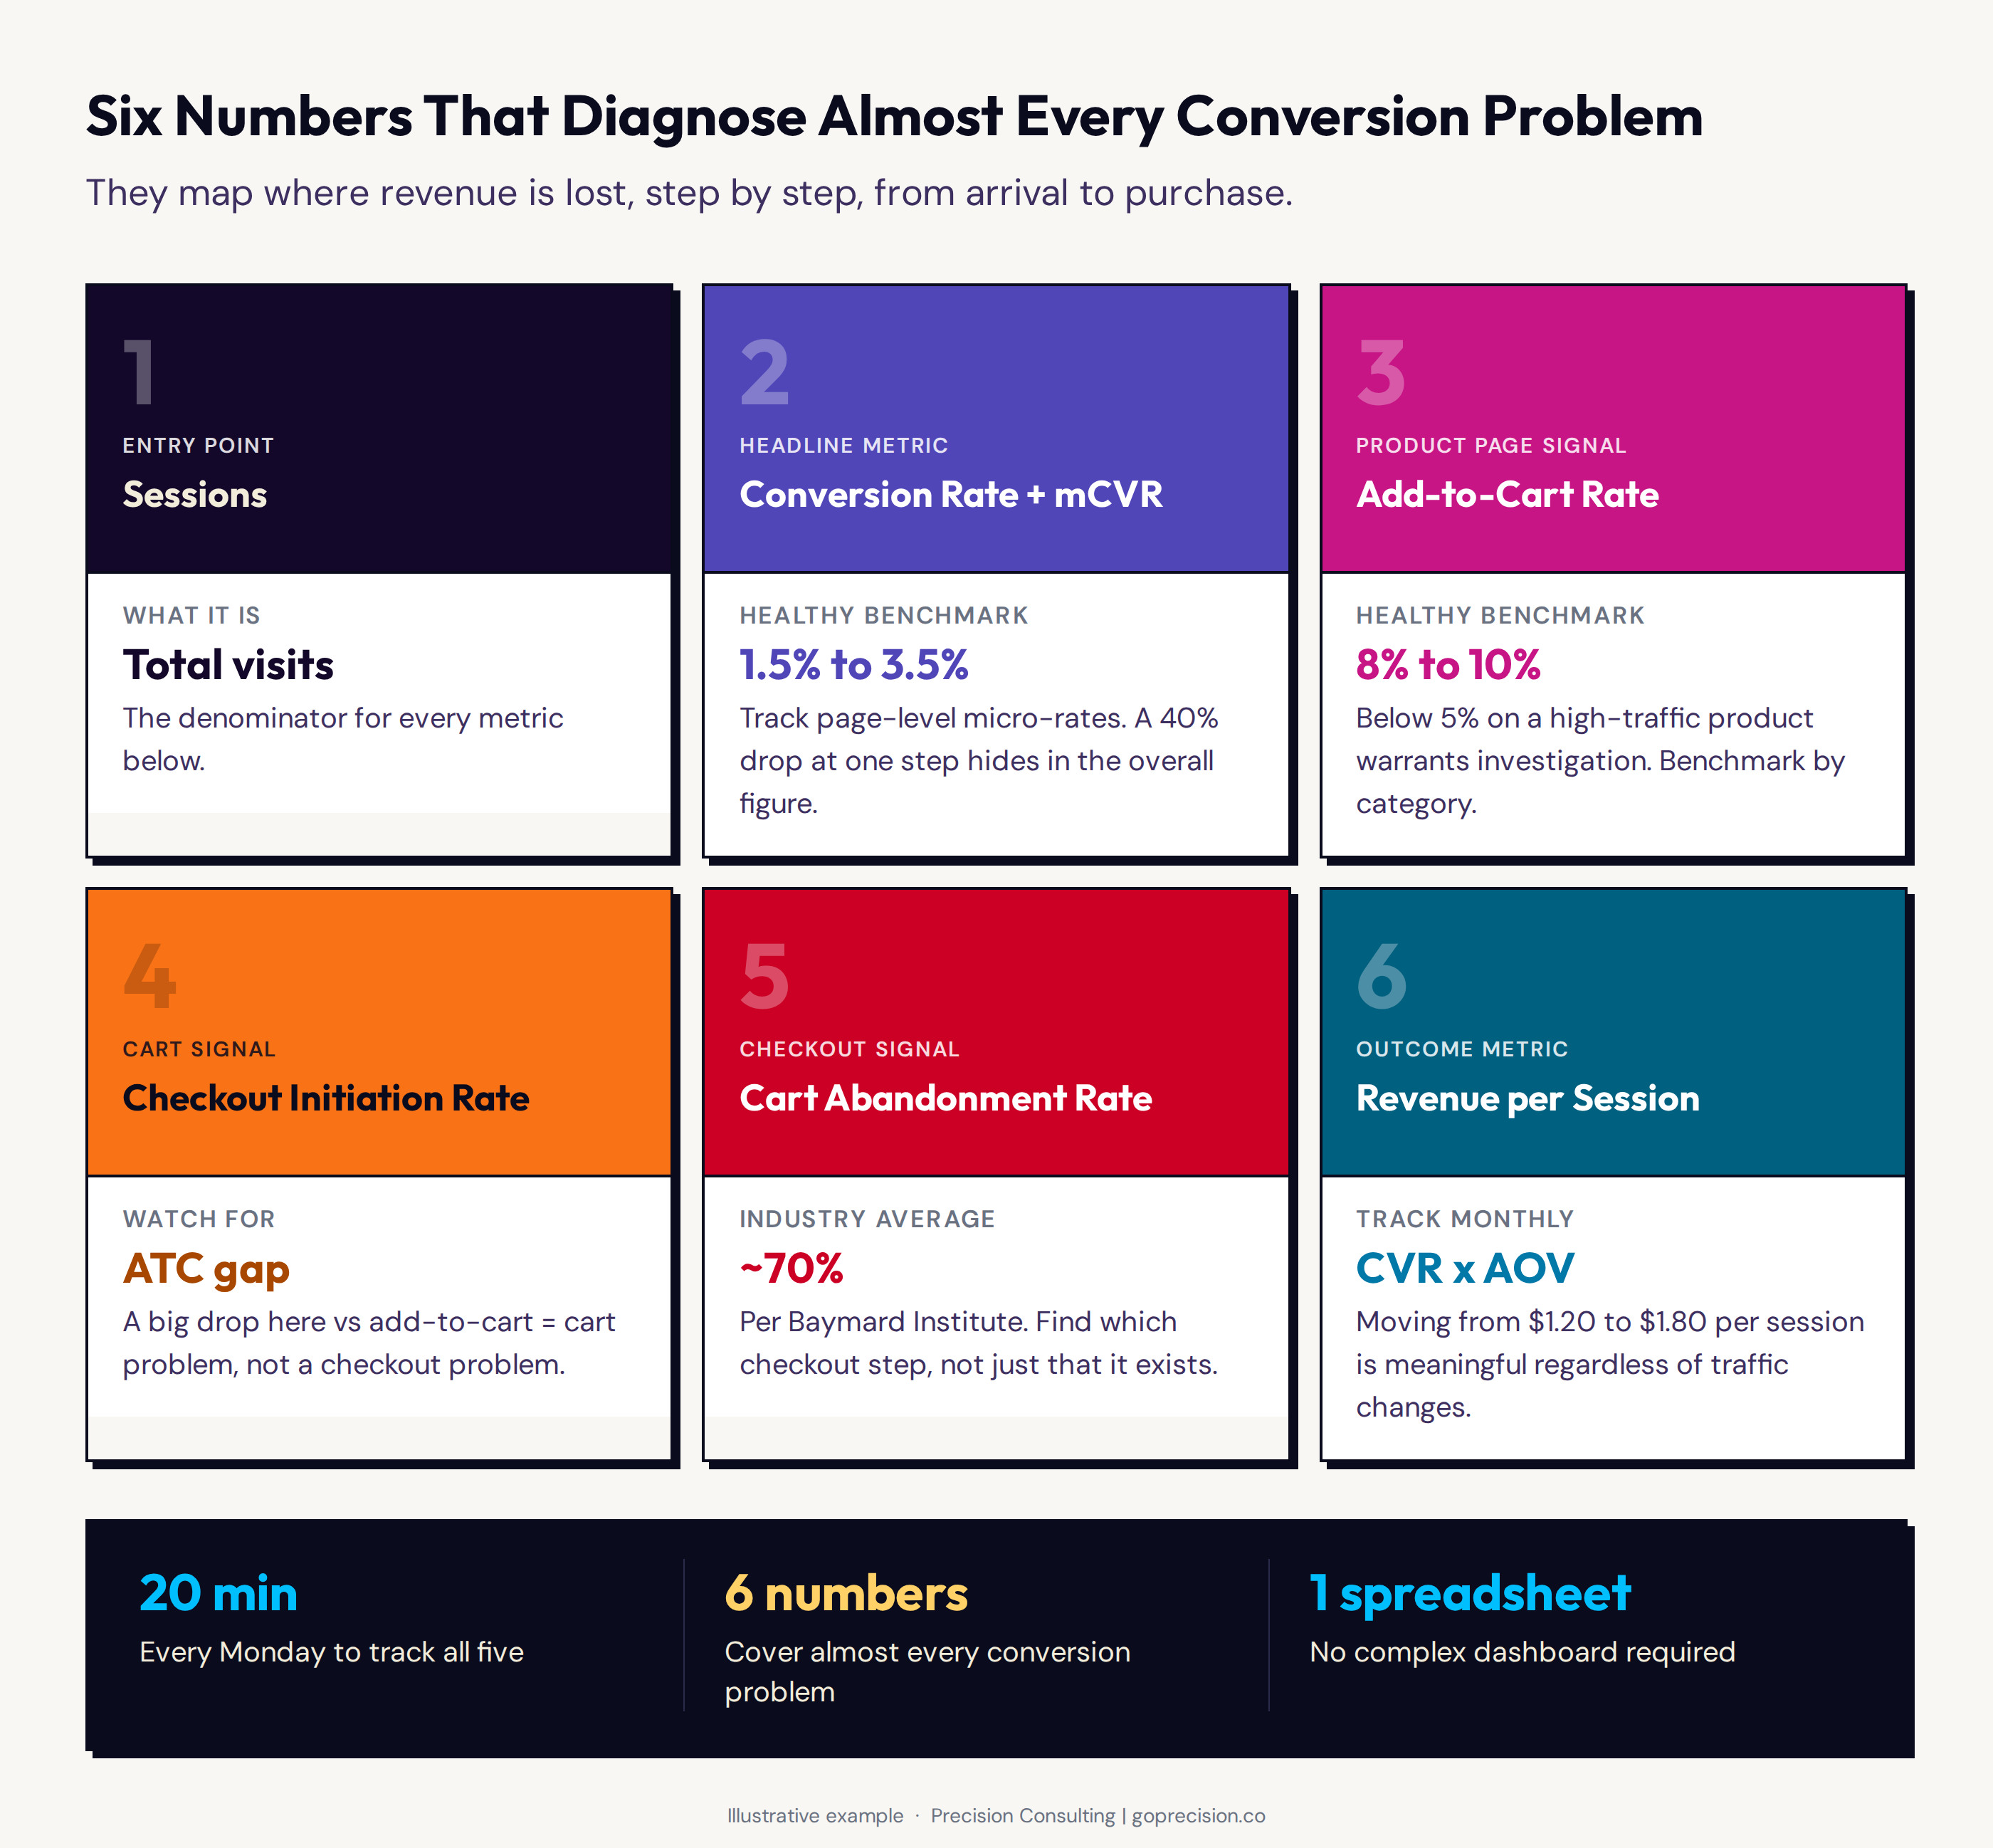
Six inbound metrics that help diagnose conversion rate problems, mapped across the e-commerce funnel from session entry to completed purchase.
How to build a simple dashboard for these five metrics
You do not need a complex analytics setup to track these five metrics. A simple spreadsheet updated weekly gives you the diagnostic view you need to identify problems and measure the impact of changes before they become expensive ones.
Twenty minutes every Monday tells you almost everything you need to know
Set aside 20 minutes each Monday. Pull the five metrics for the prior week from Shopify Analytics and GA4. Record them in a spreadsheet alongside the same week from the prior year and the rolling four-week average. Five numbers. Twenty minutes. That is enough to catch most problems before they compound.
You are not looking at absolute numbers in isolation. You are looking at changes in the relationship between them. Traffic flat, conversion down: the problem is on-site. Add-to-cart rate holding, checkout initiation dropping: cart problem. Checkout initiation steady, cart abandonment up: something broke inside the checkout. The metrics narrow the search before you spend a minute watching recordings.
A drop in conversion rate is not always a checkout problem
When the conversion rate drops, the two most common assumptions are that it is a checkout problem or a traffic problem. Both are usually wrong, and both lead to wasted time because they start from a conclusion rather than from the data.
The checkout assumption sends people digging into payment flows and checkout UX when the product pages are actually what broke. The traffic assumption sends people auditing their ad campaigns when the checkout is actually what broke. And within traffic, the picture is more specific: if new customer acquisition has dropped but returning customers are stable, the issue is likely a targeting change or creative fatigue in a paid campaign, not a site problem at all.
The right move is to check the funnel metrics in order. Overall conversion down: check add-to-cart rate. If add-to-cart is also down, the problem is at the product page or upstream. If add-to-cart is stable but checkout initiation has dropped, the cart is where to look. If checkout initiation is fine but cart abandonment has risen, go inside the checkout step by step. The data will tell you where the break is. Your job is to follow it rather than guess.
A conversion rate drop is a signal to read the funnel, not to pick a culprit. Checkout problem, traffic problem, product page problem: all three are possible, and all three require different fixes. The five metrics narrow the search in minutes. Starting without them means diagnosing the wrong thing confidently.
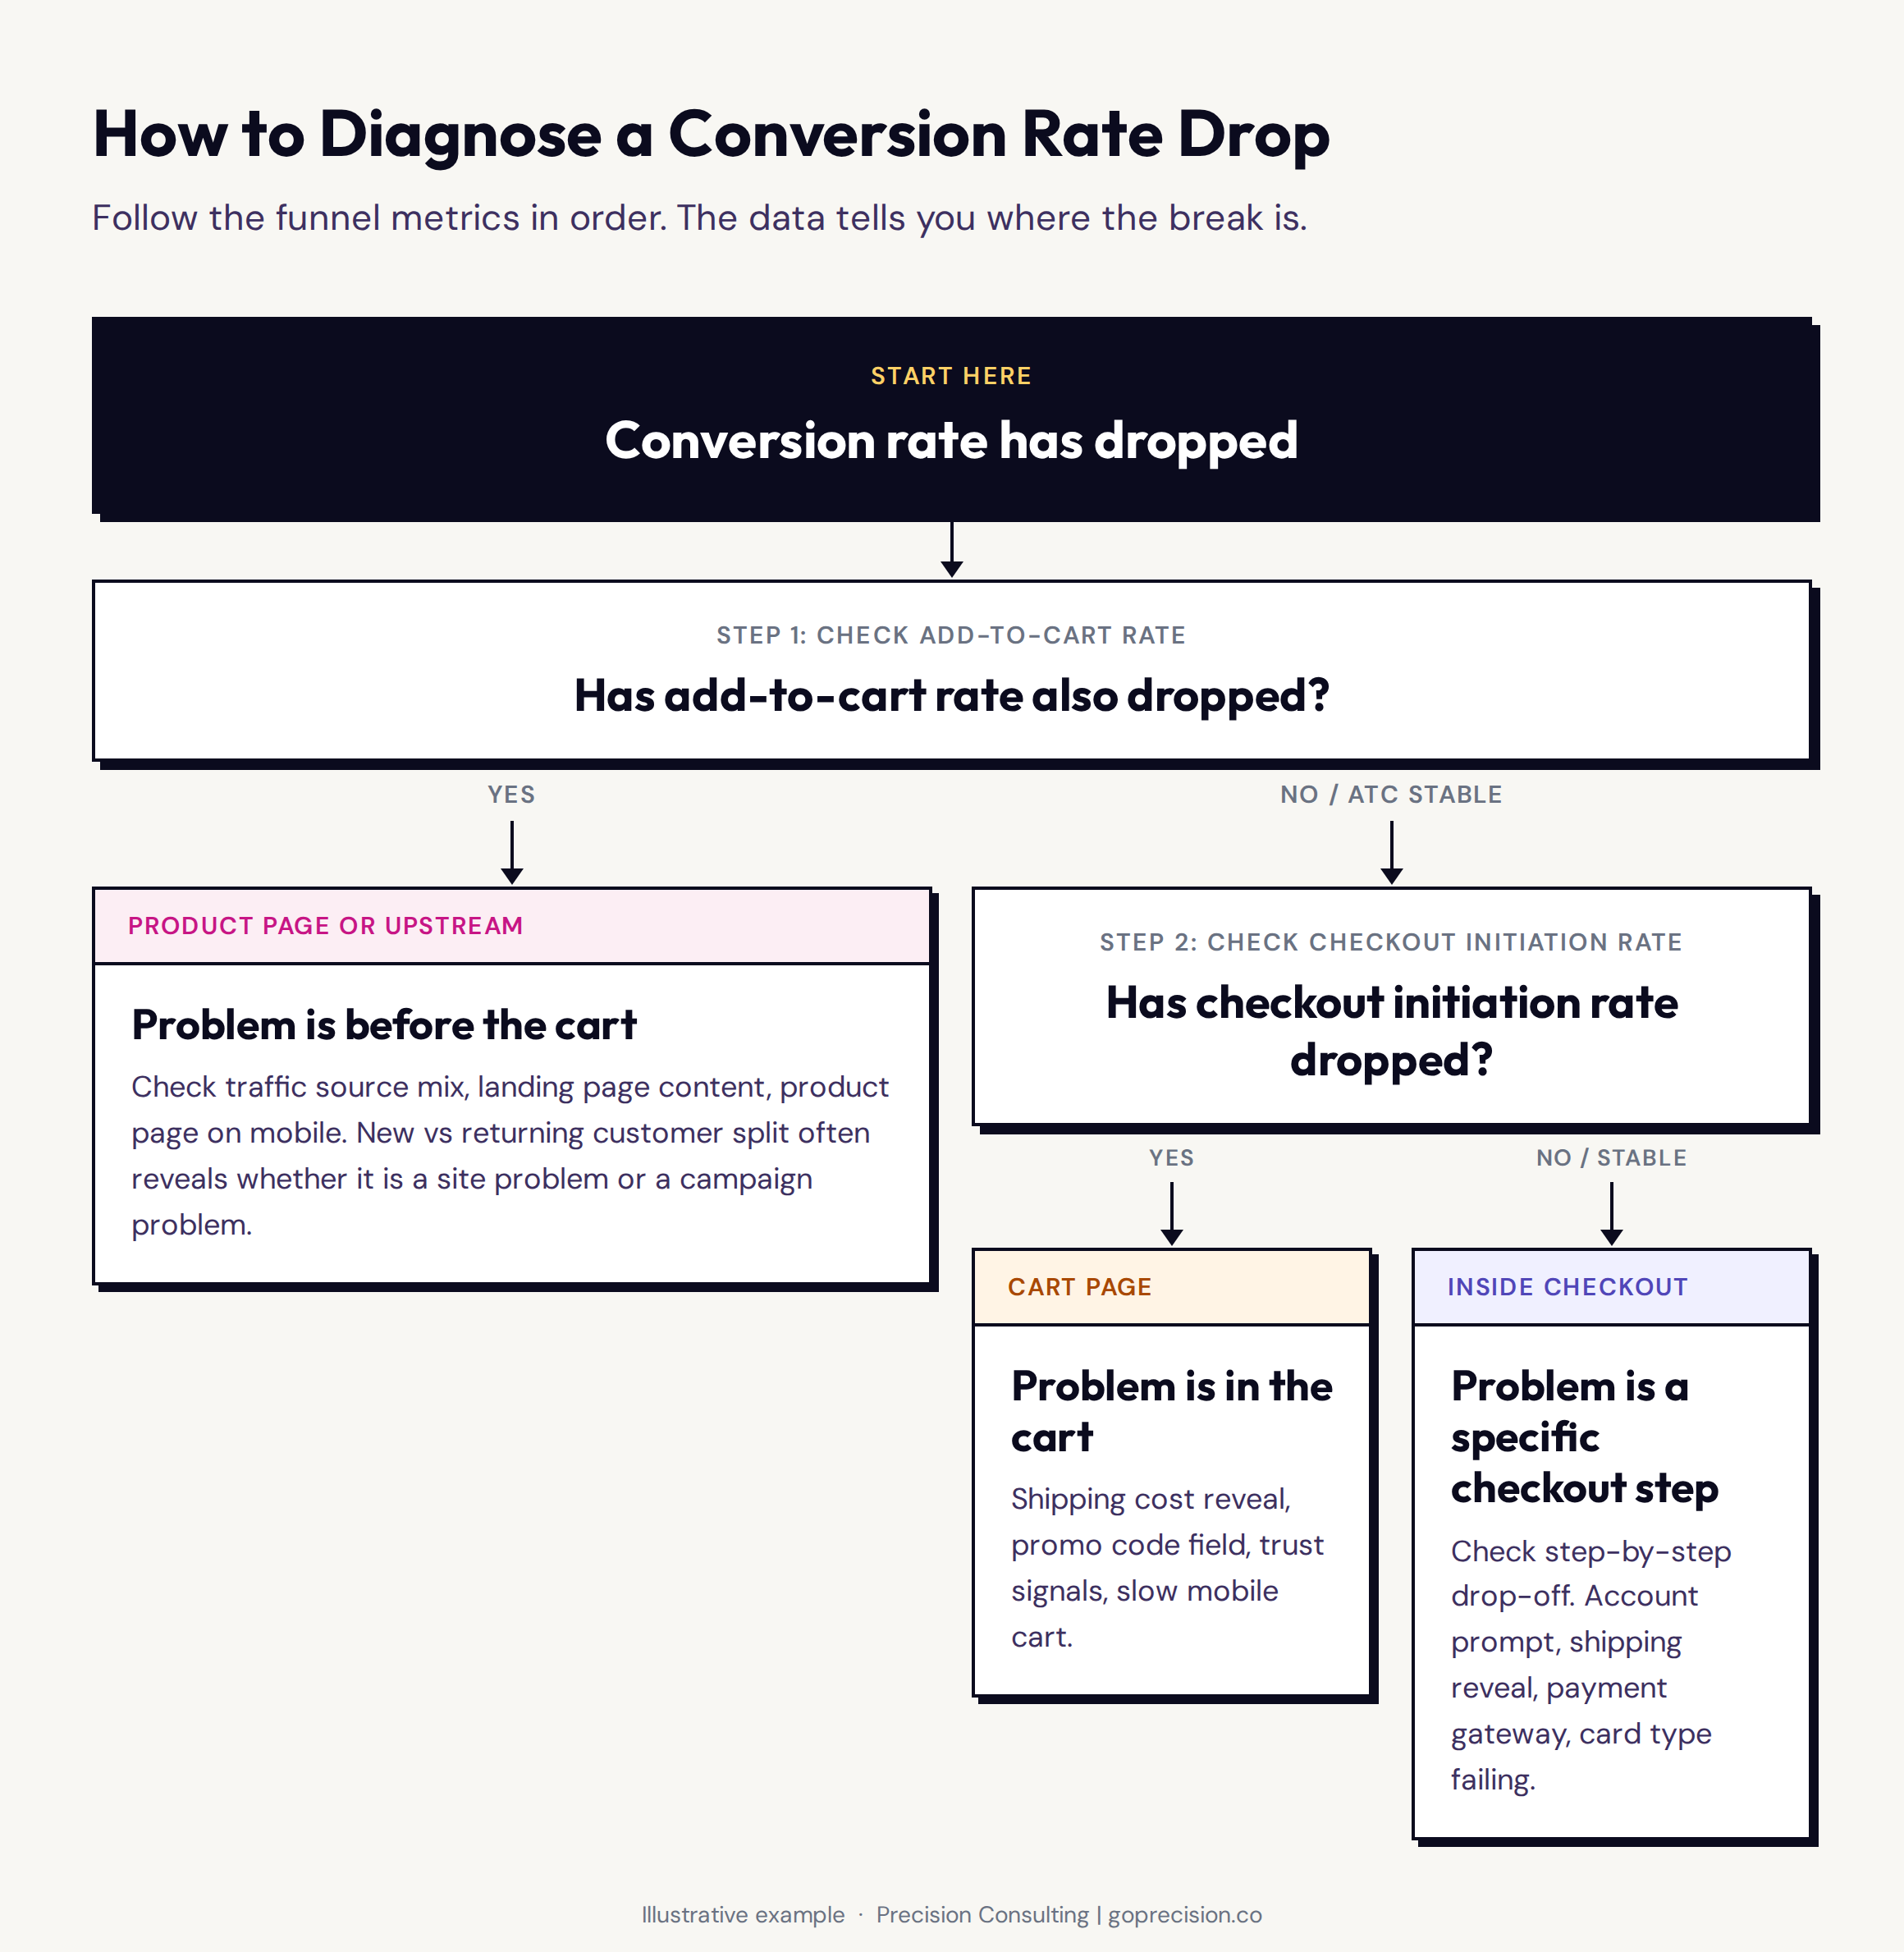
How to read a conversion rate drop: follow the funnel metrics in order before drawing any conclusions.
If you want to see exactly where your store is losing revenue across these five metrics, request your free audit and we will walk through the numbers together.
Which analytics mistakes distort your numbers?
Analytics data is only as reliable as the implementation behind it. What turns up most often when auditing a store's analytics is not missing data but distorted data: numbers that look plausible but are measuring something slightly different from what you assume.
Your session count is inflated, and your conversion rate looks worse than it is
Duplicate session tracking occurs when the analytics tracking code fires more than once on a page load. It inflates your session count, which artificially depresses your conversion rate and revenue per session. The conversions have not changed, but the denominator in your calculation has grown, so the rate looks worse than it is.
Check for this by comparing Shopify's reported order count against GA4's reported transactions. If the numbers differ significantly, you have a tracking discrepancy worth investigating. Shopify's own reported conversion rate is generally more reliable than GA4's in this respect because it does not depend on client-side tracking code implementation.
Not all your sessions are with real buyers
Automated bots, spam referrals, and crawler traffic can significantly inflate session counts without any conversion potential. A suspiciously high bounce rate from a specific referral source, or sessions from geographic locations that produce zero revenue across months, are likely bot sessions. Filtering them in GA4 improves the accuracy of every diagnostic metric downstream.
Shopify and GA4 will always show different numbers, and both are right
Shopify and GA4 attribute conversions differently. Shopify uses a last-click, 30-day attribution window. GA4 uses data-driven attribution or last-click, depending on your configuration. When comparing revenue figures between the two, attribution differences create apparent discrepancies that are not real changes in performance.
For the five diagnostic metrics, use Shopify's native reports as your primary source. The attribution is consistent and does not require custom configuration. Use GA4 for funnel-level analysis where Shopify's funnel reporting is less detailed, and for traffic source breakdown when you need to understand where drop-offs are coming from.
Before acting on any diagnostic, it is worth running through a basic analytics audit to confirm your tracking is firing correctly at each funnel step. Misattributed sessions and misfiring checkout events are more common than most founders expect.
What to do when the numbers are not where they should be
Identifying a metric that is below the benchmark is the start of the diagnostic, not the end of it. Knowing that your add-to-cart rate is 3.5% tells you that product pages are underperforming. It does not tell you why. The next step is always qualitative: watch session recordings on your highest-traffic product pages, run a short survey asking visitors what stopped them from adding to cart, or conduct a basic usability test with five representative users.
The combination of quantitative metrics to locate the problem and qualitative research to understand it is the core of how effective CRO works. Neither is sufficient alone. Metrics without qualitative understanding produce tests based on guesses. Qualitative research without metrics produces improvements to the wrong parts of the funnel.
Start with the metric that is furthest from the benchmark. Fix one thing at a time. Measure the impact. Move to the next. This is slower than changing everything at once, but it is the only way to know what worked.
If you are not sure where to start, the discipline of A/B testing gives you a structured way to validate a fix before rolling it out site-wide, particularly for higher-traffic pages where the wrong change at scale costs more than the test did.
If you want a structured read of these five metrics for your store, including where the drop-off is and what is most likely behind it, see how Precision structures its diagnostic engagements, or book a free strategy call to walk through your current numbers together.
Don't Make Me Think by Steve Krug covers the usability principles that determine whether visitors can navigate a store effectively — directly relevant to understanding add-to-cart and checkout funnel drop-offs. Predictably Irrational by Dan Ariely provides the psychological framework for understanding why buyers behave in ways that analytics reveals but does not explain. Information Architecture for the Web and Beyond by Peter Morville and Louis Rosenfeld covers how people find and navigate information, which maps closely to the behaviours your funnel metrics surface.
Key Takeaways
- Five metrics cover almost everything you need to diagnose where your store is losing revenue: conversion rate, add-to-cart rate, checkout initiation rate, cart abandonment rate, and revenue per session.
- Your overall conversion rate is a summary. The page-level micro-conversion rates between each funnel step are where the diagnostic value lives. A 1.5% end-to-end rate can be hiding a 40% drop-off at a single step.
- Outcome metrics like total revenue and total sessions tell you what happened. Diagnostic metrics tell you where in the funnel it happened. Use both, but act on the diagnostic ones.
- Add-to-cart benchmarks of 8% to 10% are market averages. A high-consideration category will look very different. Always benchmark against your own historical data and category-specific norms before deciding your rate is a problem.
- According to the Baymard Institute, the average cart abandonment rate across e-commerce is approximately 70%. If yours is materially higher, identify the specific checkout step with the largest drop-off and investigate that step first.
- A drop in conversion rate is not automatically a checkout problem or a traffic problem. Both assumptions lead to diagnosing the wrong thing. Read the funnel metrics in order to find where the break actually is.
- Revenue per session is the single most honest measure of CRO progress over time. It captures conversion rate and AOV in one number and makes the compound effect of improvements visible.
Frequently Asked Questions
What e-commerce analytics metrics should I track?
The five most diagnostic metrics for e-commerce are conversion rate, add-to-cart rate, checkout initiation rate, cart abandonment rate, and revenue per session. Together, they map the full customer journey from arrival to purchase and tell you specifically where revenue is being lost. Within conversion rate, tracking page-level micro-conversion rates between each funnel step gives you the most precise view of where leakage is occurring.
What is a good e-commerce conversion rate?
A healthy e-commerce conversion rate for most categories sits between 1.5% and 3.5%. Fashion and apparel typically benchmark lower, health and beauty higher. The most useful benchmark is your own historical trend. A rate that is improving month over month against your own baseline is more meaningful than one that matches an industry average but is declining.
How do I find my conversion rate in Shopify?
In Shopify, go to Analytics, then Reports, then Online Store, then Conversion rate. Set the date range to the last 30 or 90 days. The funnel view below the headline rate, showing sessions added to cart, reached checkout, and completed, is the most useful diagnostic view in the platform.
What is the cart abandonment rate, and how do I reduce it?
Cart abandonment rate is the percentage of checkout sessions started but not completed. The average across e-commerce is approximately 70% per the Baymard Institute. To reduce it, identify the specific checkout step where the largest drop-off occurs and address the friction at that step. The account creation prompt, unexpected shipping costs, and limited payment options are the most consistent culprits.
What is the difference between Shopify Analytics and Google Analytics?
Shopify Analytics uses Shopify's own session and order data, which tends to be more reliable for conversion and revenue metrics because it does not depend on a client-side tracking code. GA4 provides more detailed funnel analysis, traffic source attribution, and user behaviour data. Use Shopify as the primary source for the five diagnostic metrics and GA4 for understanding where traffic is coming from and how different sources behave through the funnel.
What is revenue per session?
Revenue per session is total revenue divided by total sessions. It combines conversion rate and average order value into a single metric that measures how much value your store extracts from each visitor. It is the most honest single metric for tracking CRO progress over time because it captures both dimensions of improvement simultaneously.
