Last updated:
Your store might be converting at 1.4% on a good month. A competitor with the same products and the same traffic is converting at 2.1%. The most likely single explanation is that their pages load faster than yours.
Page speed measures how quickly your website loads and becomes usable. It is one of the strongest predictors of whether a visitor converts or leaves. That relationship is why this is not a technical concern that belongs in a ticket queue. It belongs in your weekly metrics.
I have sat in enough post-mortems on struggling stores to know the version of this that keeps repeating. Months spent on product photography. Copy rewrites. Checkout experiments. Conversion barely moves. Then someone runs a speed audit. Shaves a second off the load time. The numbers shift inside two weeks. The product was fine the whole time. Buyers were leaving before they got to see it.
At Precision, speed analysis is part of every audit and sprint engagement. Before recommending any CRO work on the page itself, we check that the page is actually reaching buyers. See how an engagement works before deciding whether the timing is right for your business.
What a slow page actually costs you
The visitor who left because your page was slow does not show up in your analytics as a speed problem. They show up as a bounce. Or they do not show up at all. They came, the page took too long, and they were gone before a single event was tracked. Your conversion data has no language for them.
That is what makes slow pages so expensive and so easy to underestimate. Deloitte's research found that a 0.1-second improvement in load time increases e-commerce conversion by 8% and lifts average order values by 9.2%. Not one second of improvement. A tenth. Google's data shows that as load time goes from one second to five seconds, bounce probability increases by 90%. The product, the price, the photography. None of it reaches the buyer who left before the page rendered.
And that abandonment happens upstream of everything you normally measure. A visitor who bounces from a slow product page never reaches the cart. They are not in your cart abandonment rate. They are not in your checkout funnel. They are simply missing.
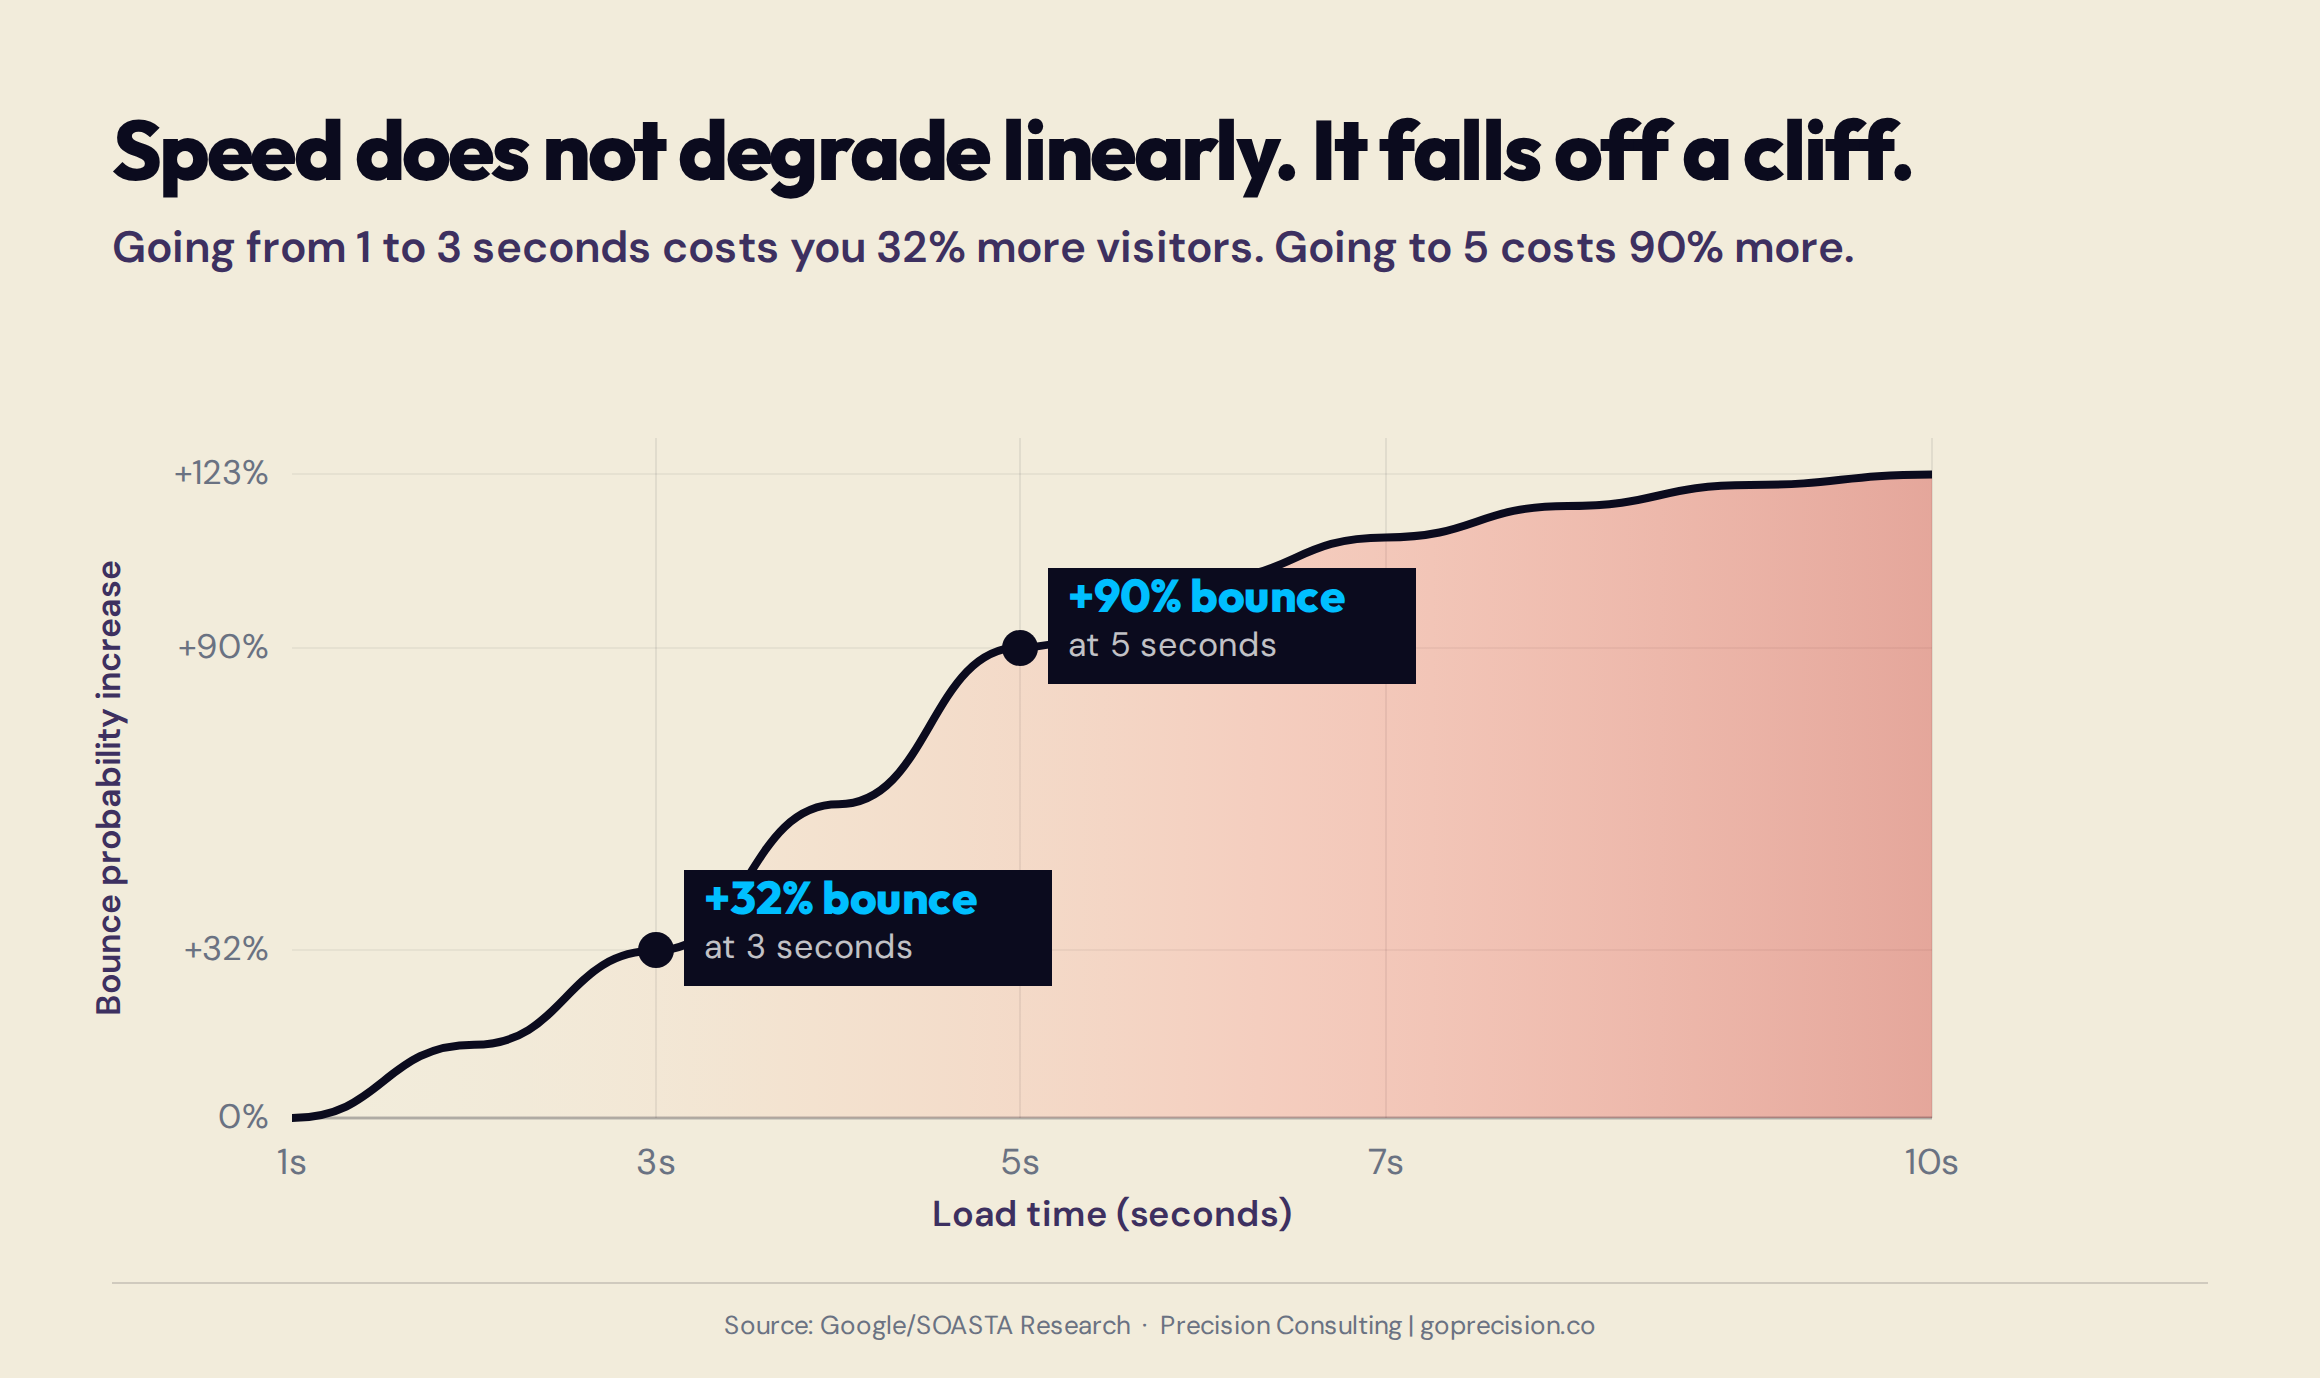
Bounce probability rises sharply as load time increases. At five seconds, a mobile visitor is 90% more likely to leave than at one second. The product, the copy, and the photography never get the chance to work.
Why mobile is where the problem is worst
The gap between mobile and desktop speed is not narrowing. Mobile networks are faster than they were five years ago, but mobile pages have also grown heavier. The average e-commerce page now exceeds 4MB on mobile, and the gap between what a mobile network can reliably deliver and what a page demands has stayed roughly constant.
The founders I talk to who have a 50% mobile traffic share and a mobile conversion rate half their desktop rate almost always attribute it to the checkout experience. Sometimes that is correct. More often, I find the mobile conversion gap begins before the checkout. It begins on the product page, where the load time on a 4G connection is three or four seconds longer than on a broadband desktop browser, and where buyers make the decision to stay or leave before the first image has fully rendered. The full breakdown of what mobile CRO actually involves goes beyond speed, but speed is almost always the right starting point.
What your mobile load time actually is
Open Google PageSpeed Insights and run your homepage, your highest-traffic product page, and your cart page on mobile. The First Contentful Paint (FCP) and Largest Contentful Paint (LCP) numbers tell you what a visitor on a typical mobile connection actually experiences. Most founders have never done this. The numbers are often sobering.
A good LCP on mobile is under 2.5 seconds. A poor LCP is over 4 seconds. If your product pages are sitting at 4 to 6 seconds, a meaningful share of your mobile visitors are deciding to leave while your page is still loading. No amount of CRO work on the page itself will reach those visitors.
Perceived Wait Bias: Research into perceived wait time consistently shows that users rate waits as longer when they cannot see progress. A page that loads in three seconds but shows a blank white screen for the first two seconds feels slower than a page that takes the same three seconds but renders progressively. This is why skeleton screens and progressive loading can reduce perceived abandonment even without improving actual load time. The feeling of speed matters alongside the fact of speed.
Speed issues are one of the first things a Precision audit identifies, because they sit upstream of every other conversion lever. If you want to understand exactly where your store is leaking revenue before you spend on fixes, request your free audit and we will walk through the diagnostics together.
Which speed fixes return the most for e-commerce stores
Every speed consultant will give you a list of twenty things to fix. Most of those things will not move your conversion. What follows are the ones that do, in rough order of how much return you get for the effort you put in.
Images: always the first thing to check
Uncompressed and oversized images are the single most common cause of slow e-commerce pages. A product page with eight high-resolution images in JPEG format, not resized for web, can easily exceed 8MB on its own. That is before the theme, the scripts, and the apps.
The fix is tedious but not complicated. Compress every product image. Convert to WebP: same visual quality, 25 to 35% smaller files. Implement lazy loading so images below the fold only load when the buyer scrolls to them. And size images to what they actually display on screen. Serving a 3,000px wide image into a 400px wide phone screen is the digital equivalent of shipping a wardrobe to someone who only needed a chair.
If you are on Shopify: the theme handles resizing automatically when you upload correctly. The problem is almost always images uploaded at print resolution that your theme then has to serve at web resolution. Fix the source file, not the theme.
Go to your PageSpeed Insights report for your highest-traffic product page. The Opportunities section will list your uncompressed images by name and show you the potential savings in kilobytes. Work through that list in order of file size. The three largest images almost always account for more than 60% of the total image payload.
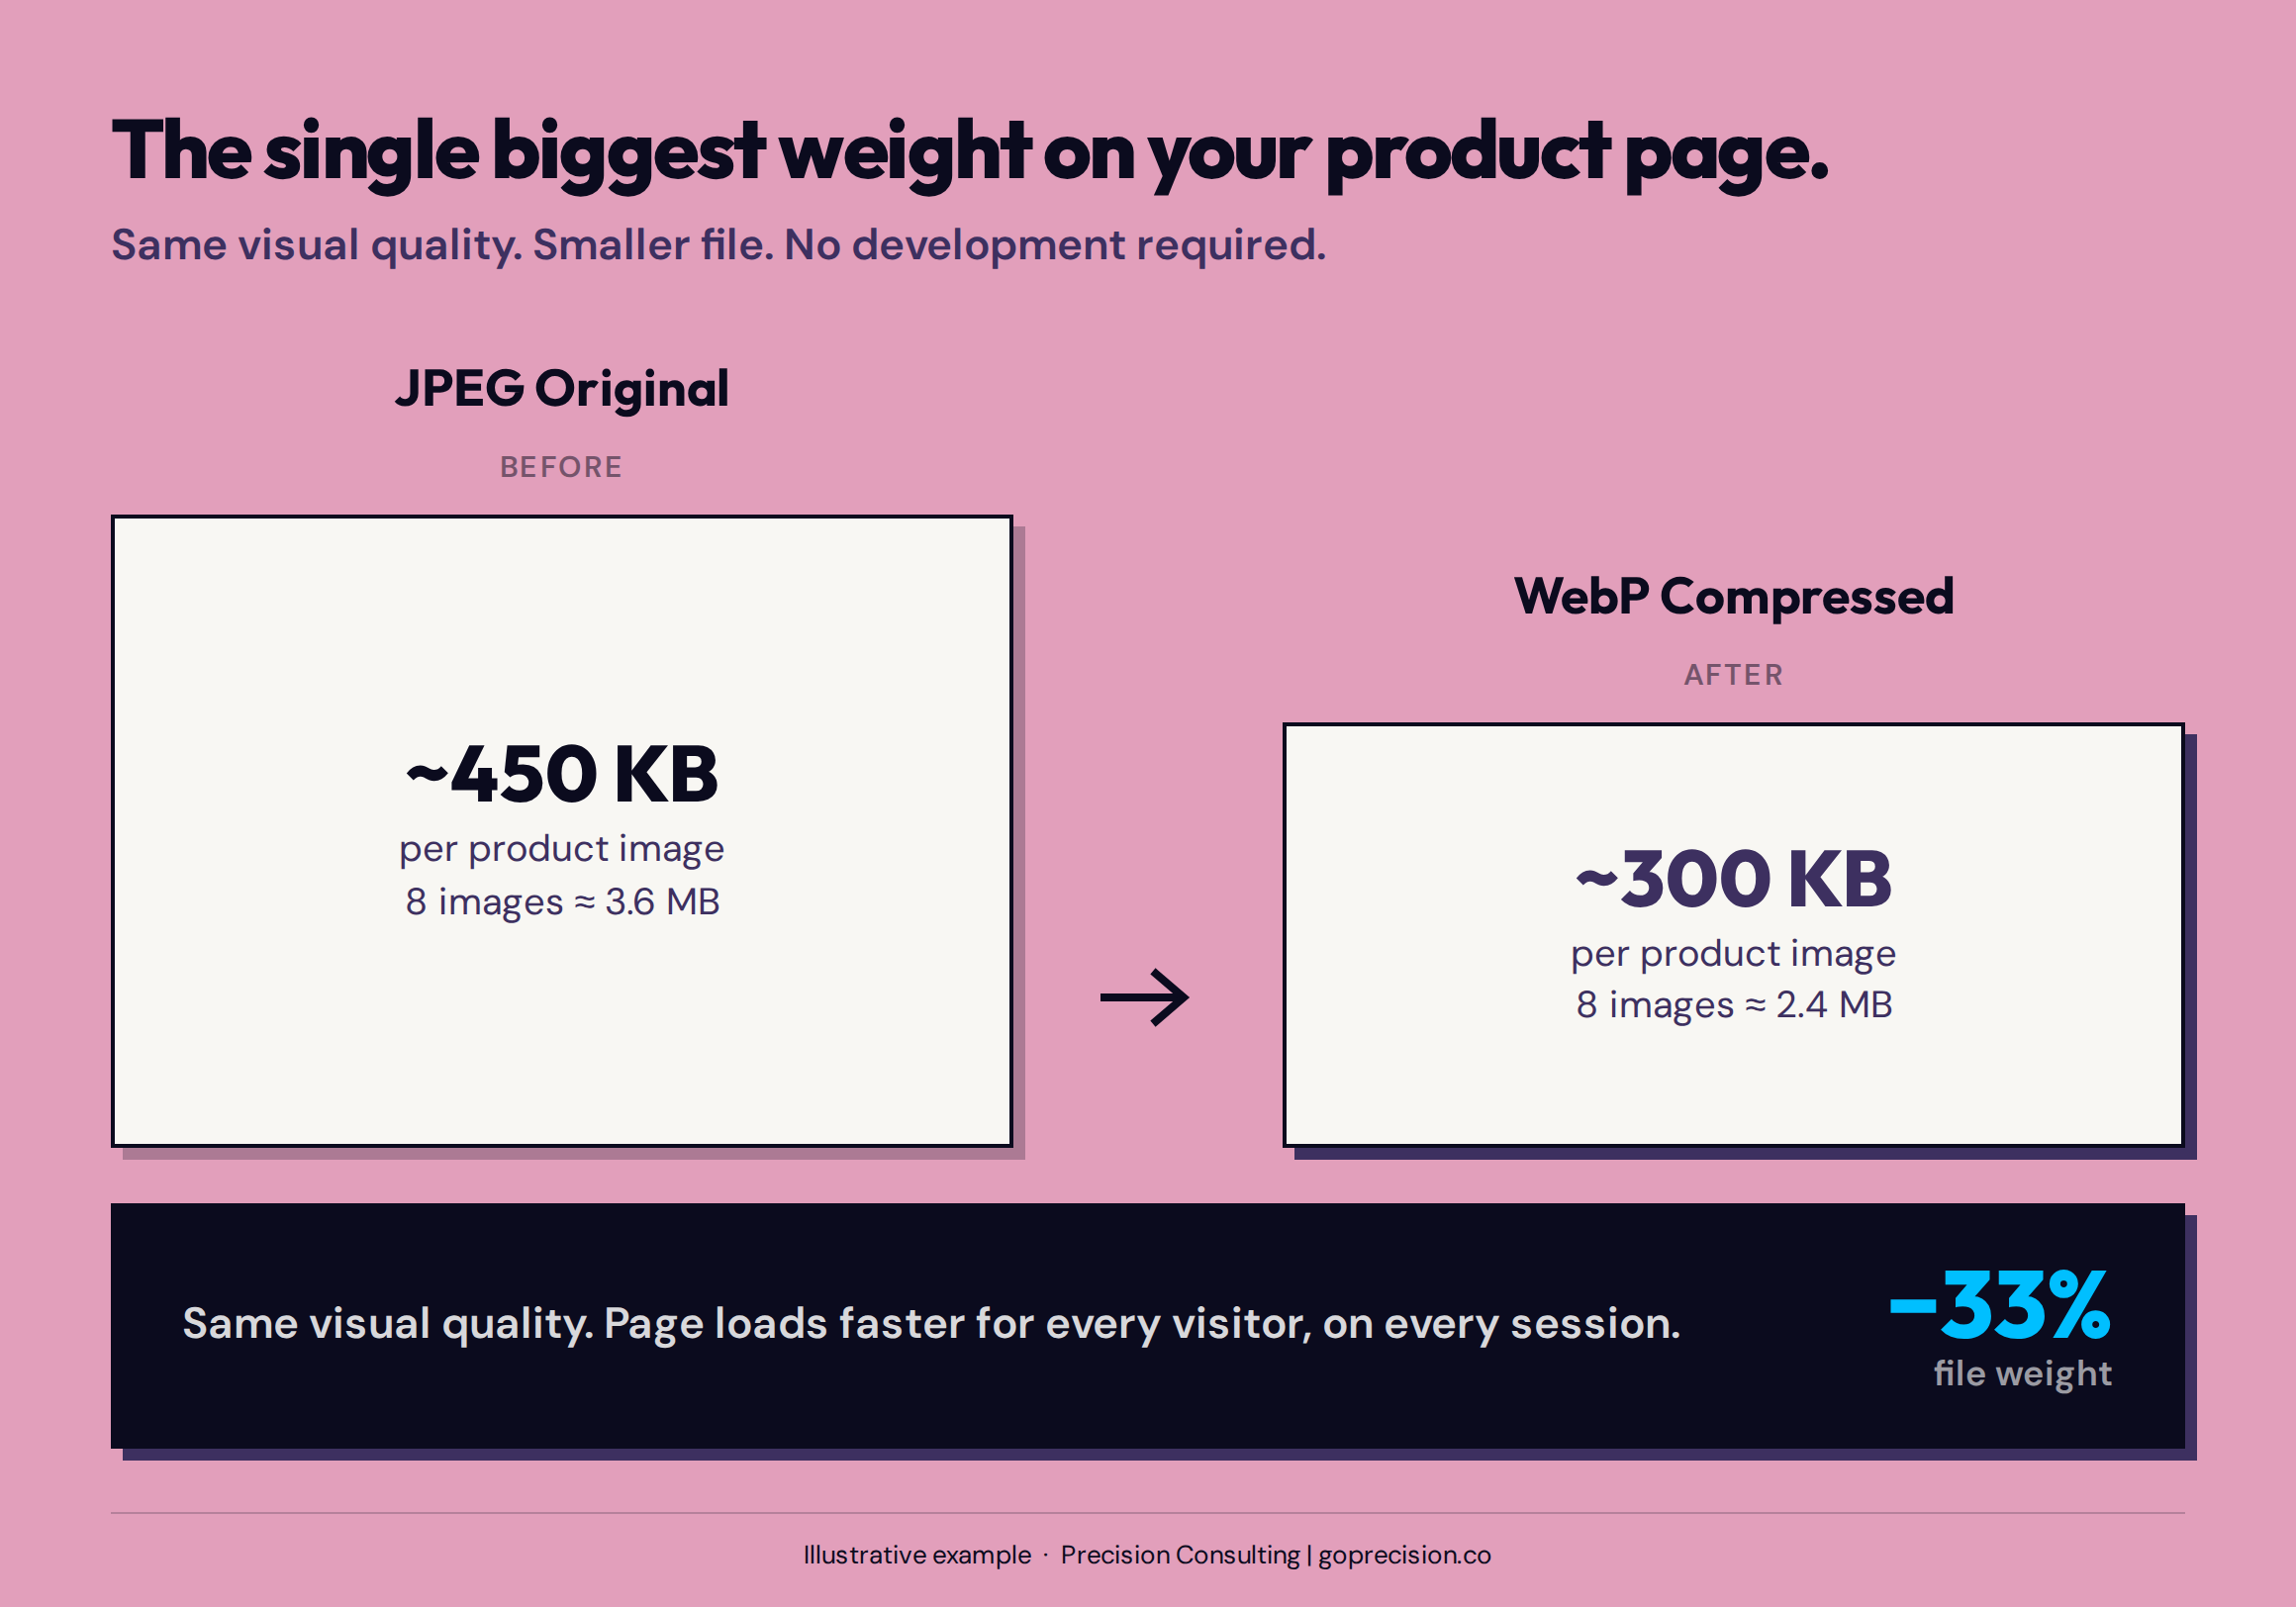
Converting product images from JPEG to compressed WebP reduces file size by 25 to 35% with no visible quality loss. For a product page with eight uncompressed images, the payload reduction is often over 3MB.
Third-party scripts: the hidden weight
Every app you install is a toll on every page load. Review pixels. Live chat widgets. Loyalty programmes. Pop-up tools. Sticky bars. Each one sends a request to an external server every time a buyer lands on your store. A store with fifteen apps running simultaneously often has more load time from scripts than from the actual page. The content your buyer came to see finishes last.
The test is simple. Go to your browser's developer tools, open the Network tab, reload a product page, and filter for JavaScript files. Count the files loading from third-party domains. Then check the time column. It is common to find 800ms to 1.5 seconds of script load time from apps the store does not actively use.
Audit your app list against your actual usage. If an app is installed but not actively contributing to revenue, remove it. Each removal is a measurable improvement to page load time, with no downside.
In Shopify admin, go to Apps and make a list of every installed app. For each one, ask: what revenue does this directly contribute to? If you cannot answer that question for an app, run without it for two weeks and measure the impact. Most stores find at least three or four apps they can remove with no commercial consequence.
Server response time and hosting
Before any image loads, before any script runs, before your buyer sees a single pixel of your store, the server has to respond. Time to First Byte (TTFB) measures how long that takes. If yours is above 600ms, everything else you fix is working against a handicap. The foundation is slow, so every element that loads on top of it inherits that slowness.
On Shopify, TTFB is mostly out of your hands. Shopify manages the infrastructure, and it is generally fast. On WooCommerce or a custom build, hosting is the lever. Shared hosting produces TTFBs in the 600ms to 1,400ms range routinely. A managed WordPress host or a VPS with full-page caching typically brings that below 300ms. That gap, invisibly, compounds into every session on your store.
Core Web Vitals and what they mean for your store
Core Web Vitals are Google's three metrics for measuring whether a page actually feels good to use: Largest Contentful Paint (LCP, does it load fast), Cumulative Layout Shift (CLS, does it stay still), and Interaction to Next Paint (INP, does it respond when you tap). They became ranking factors in 2024. Poor scores cost you twice: conversion rate goes down, and organic rankings go with it. The relationship between technical performance and search visibility is covered in more depth in the comparison of CRO and SEO and why both compound when addressed together.
CLS is the one that quietly kills mobile conversion in ways founders never trace back to speed. Your buyer taps Add to Cart. The button moves as an image loads above it. They tap something they did not mean to tap. Or they decide the whole experience feels unreliable and leave. You see cart abandonment. The real cause was a layout that did not hold still. Fixing it is unsexy: give every image and embed an explicit width and height attribute, so the browser reserves the space before the asset loads.
A quick CLS test: load your product page on mobile, watch for anything that moves or jumps as the page finishes loading. Every jump is a CLS event. Each one creates a moment where a buyer's tap lands somewhere they did not intend.
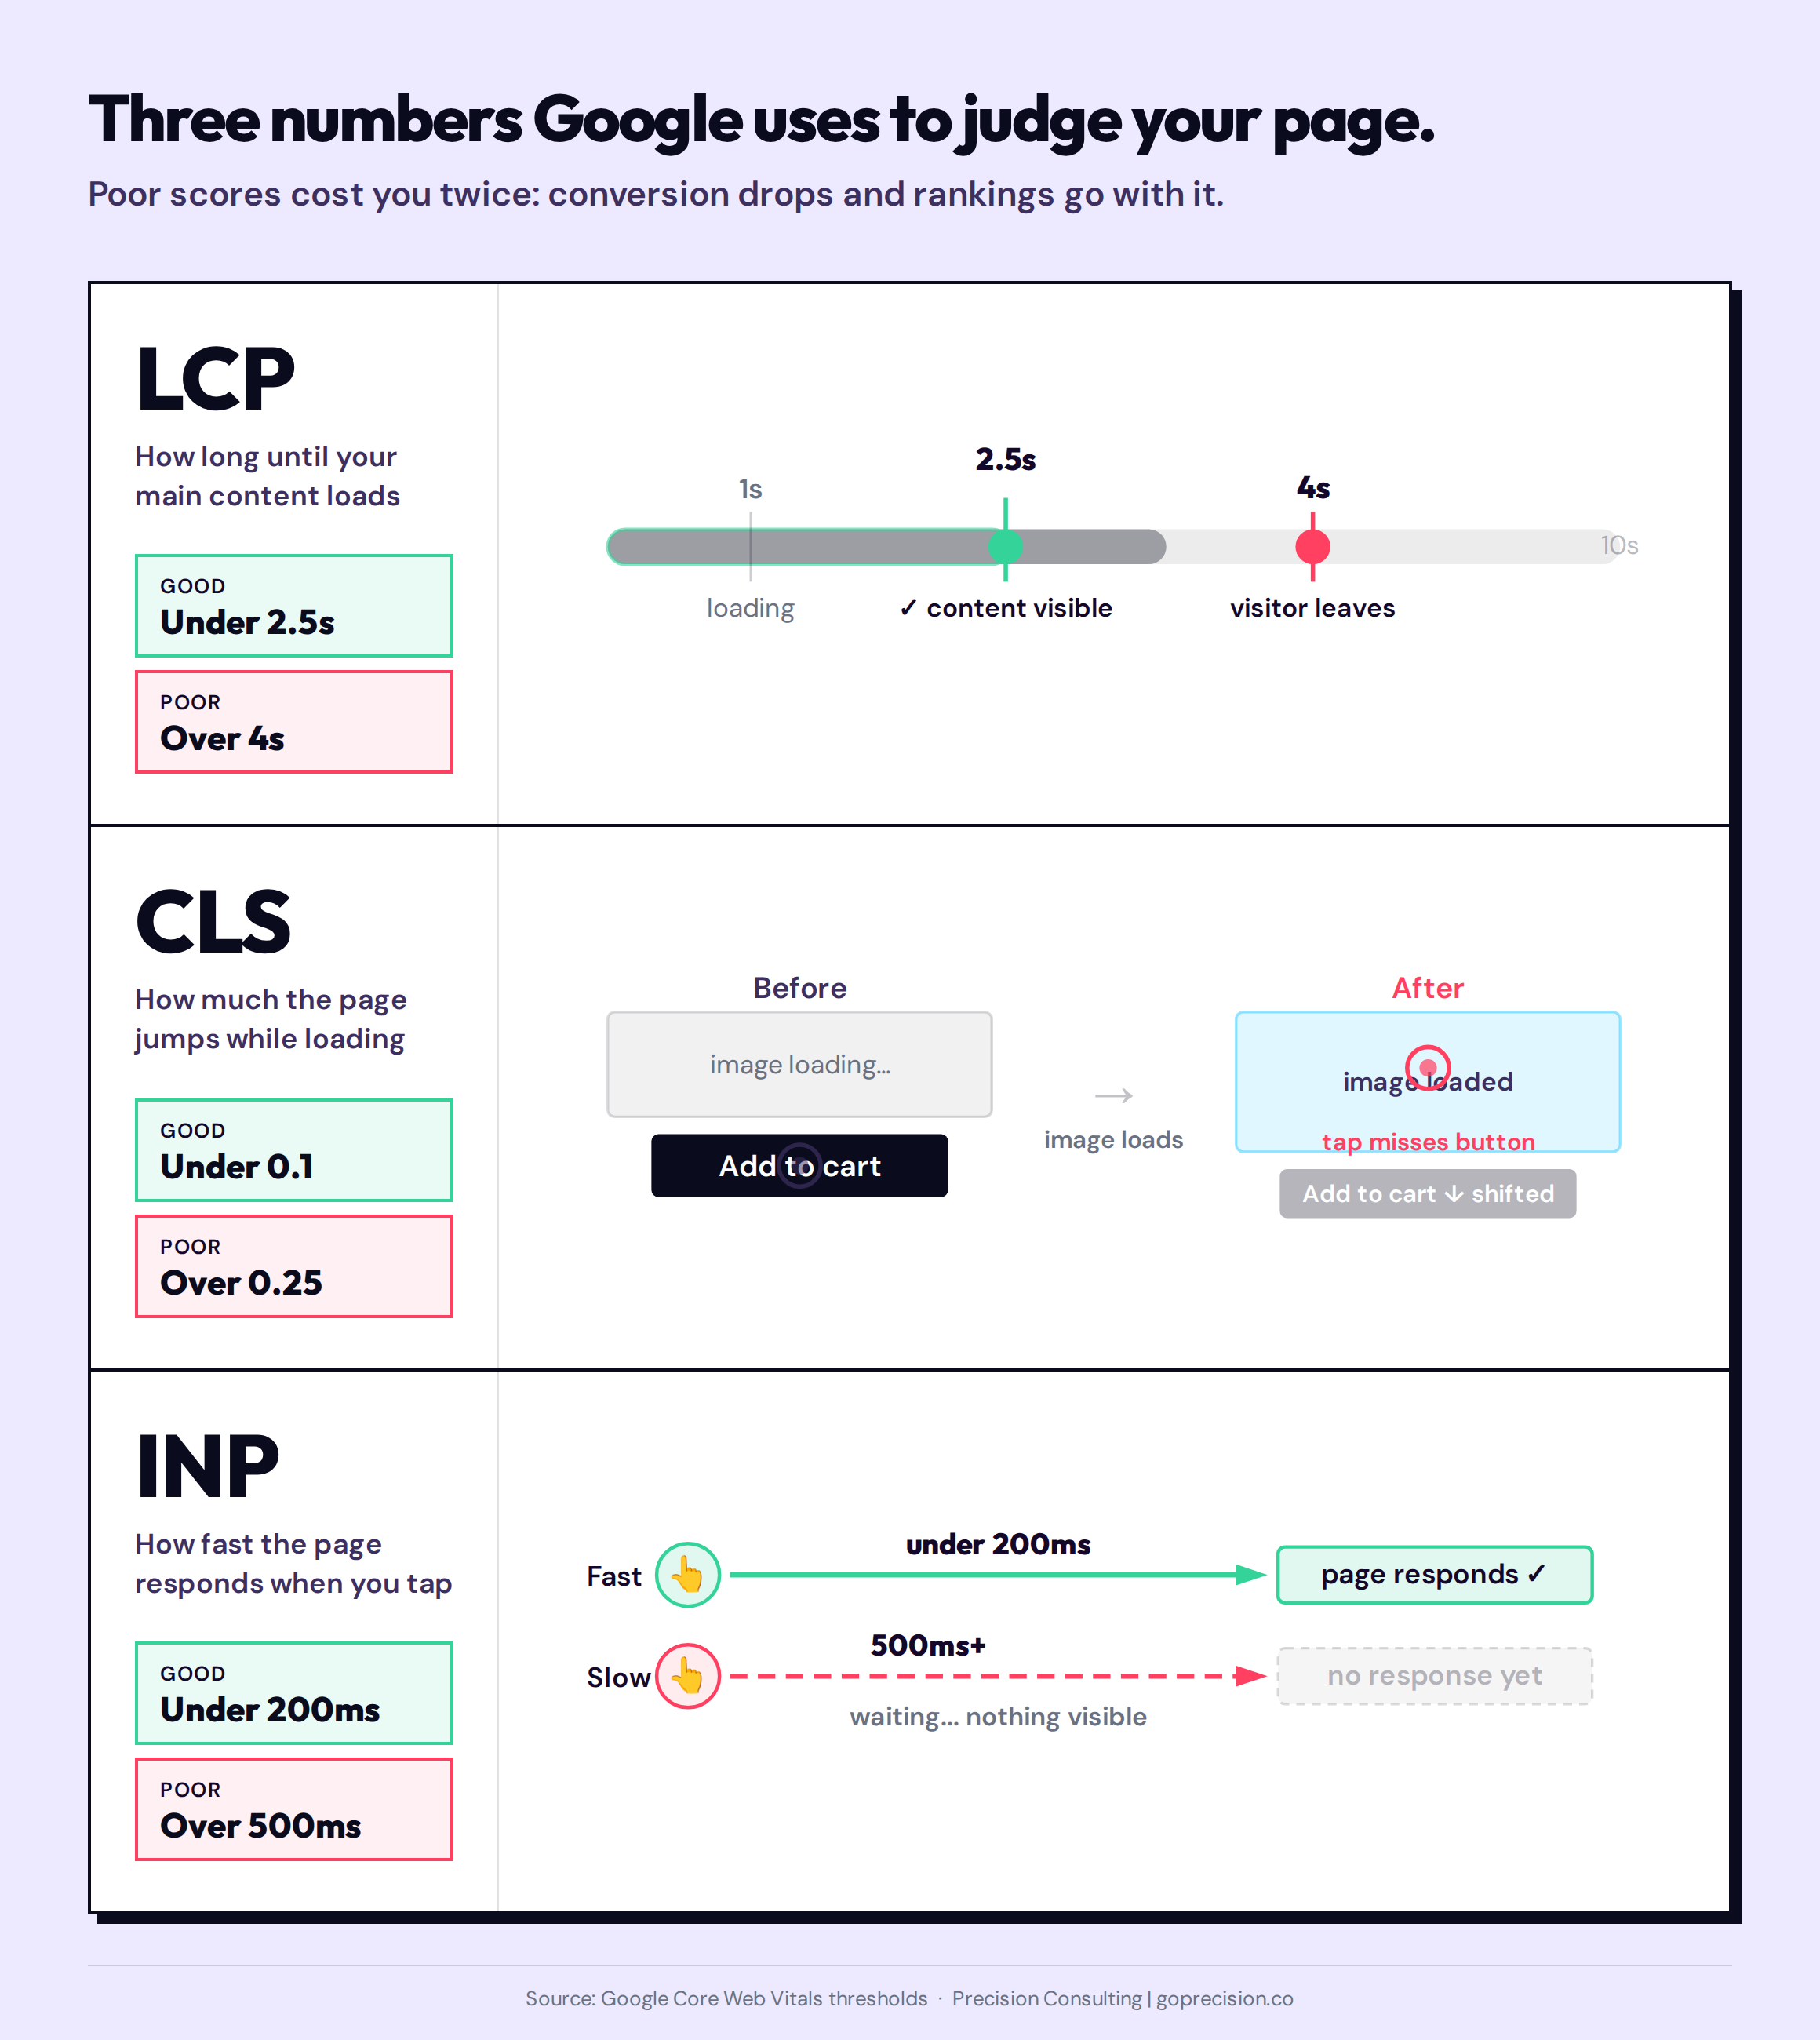
The three Core Web Vitals measure speed, stability, and responsiveness. For e-commerce, CLS is the metric most directly connected to accidental cart abandonment on mobile.
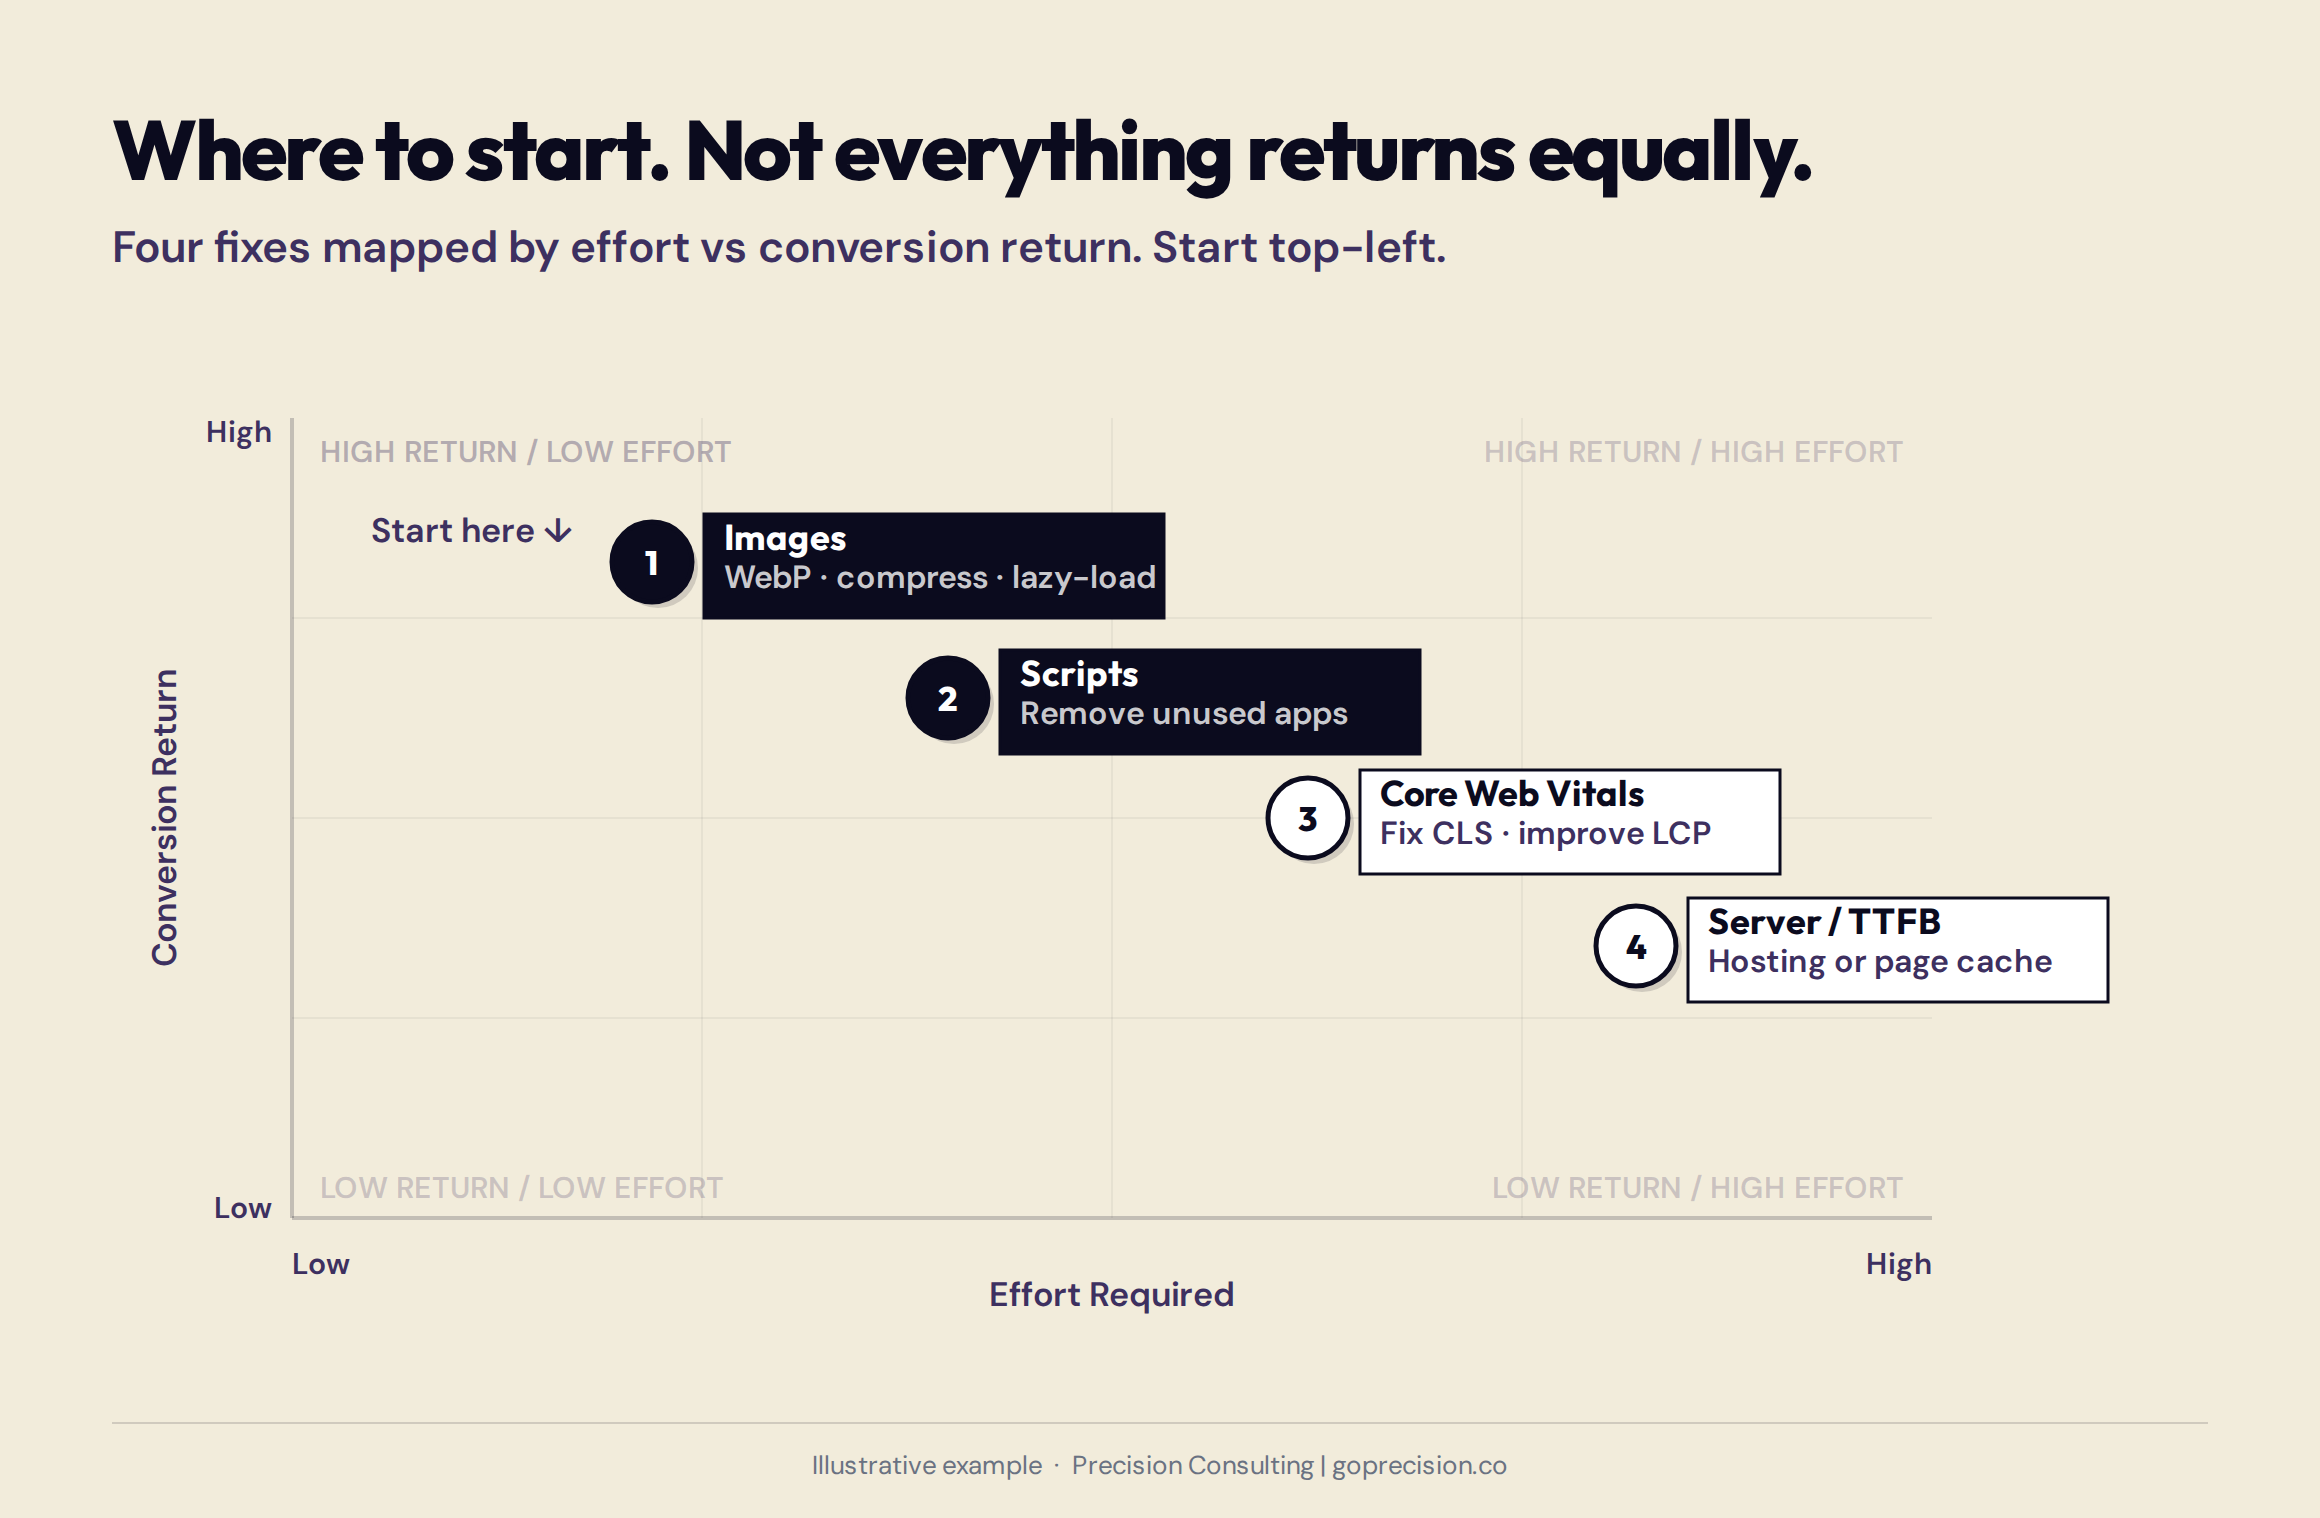
Where to start with speed optimisation: image compression and lazy loading return the most for the least effort. Third-party script audits follow. Server and CDN improvements require more resource but compound across every session on the store.
What to measure and how to know it is working
The trap with speed work is declaring victory too early. You compress the images, check PageSpeed Insights, see the score improve, and move on. The question that matters is whether revenue per session moved. That requires a baseline before you start and patience after.
Before touching anything: record your PageSpeed Insights scores for your three most important pages and your current revenue per session on mobile, filtered separately from desktop in your analytics. After implementing a fix, wait two full weeks before measuring. Speed improvements change behaviour gradually. A week is not enough window to see the return. The fundamentals of reading your analytics correctly before drawing conclusions are covered in the guide to reading e-commerce analytics.
Measure revenue per session on mobile, not bounce rate. Bounce rate is almost useless for speed diagnosis because it cannot tell you why someone left. Revenue per session on mobile, tracked week over week, tells you whether the speed work is actually converting. That is the number. Everything else is noise.
The starting point for any speed diagnostic is the same as the starting point for any structured CRO programme: knowing what to measure before making any changes. Our CRO audit checklist covers the analytics and data hygiene steps that sit underneath both.
- Deloitte found a 0.1-second improvement in load time increases e-commerce conversion by 8% and average order value by 9.2%. Speed is not a technical priority. It is a revenue priority.
- Speed-related abandonment happens before the cart. It does not appear in cart abandonment data. Most standard CRO analysis misses it entirely.
- Mobile is where the problem is most severe. A mobile LCP above 4 seconds is costing you a measurable share of visitors before they see your product, your copy, or your price.
- Images are the highest-return fix in almost every store. Compress, convert to WebP, implement lazy loading, and size correctly. These changes require no development and can often be completed in a day.
- Third-party scripts are the hidden weight. Each app you install adds load time. Audit your app list against actual revenue contribution and remove anything that cannot justify its presence.
- Core Web Vitals matter for both conversion and rankings. CLS specifically causes accidental cart abandonment on mobile. Fix it by giving all images and embeds explicit width and height attributes.
- Measure revenue per session on mobile before and after speed work, filtered separately from desktop. That number tells you whether the improvements are converting, where bounce rate does not.
If you want to understand what speed issues are costing your store specifically, and which fixes would return the most for your funnel at this stage, our CRO services cover speed analysis as part of every diagnostic engagement. The audit identifies the pages where load time is suppressing conversion, the fixes with the highest return for your traffic levels, and the measurement framework to know whether the work is producing results.
- Predictably Irrational by Dan Ariely covers the psychology of expectation and perceived value. The same mechanisms that make buyers sensitive to a one-second delay (expectation, anchoring, the cost of violated trust) are mechanisms Ariely traces through dozens of buying scenarios. Understanding why slow pages feel worse than they are helps explain why the conversion impact of speed improvements consistently exceeds what founders predict.
- Don't Make Me Think by Steve Krug covers the relationship between effort and user behaviour in digital interfaces. His central argument: users abandon anything that requires unexpected cognitive or physical effort. This applies directly to page load time. A page that makes buyers wait is a page that makes buyers work.
- Influence by Robert Cialdini explains why first impressions and early signals of credibility shape everything that follows in a buyer's decision process. A slow page is an early signal of unreliability, and Cialdini's work explains why that signal is so hard for the rest of the experience to reverse.
How does page speed affect conversion rate?
Page speed affects conversion rate directly because buyers make the decision to stay or leave before a slow page finishes loading. Google's research shows that as load time increases from one second to three seconds, mobile bounce probability increases by 32%. Deloitte's analysis found that a 0.1-second improvement in load time increases conversion by 8%. The mechanism is not patience. It is expectation. Buyers expect a page to load immediately, and the moment that expectation is violated, trust in the experience erodes.
What is a good page load time for e-commerce?
For e-commerce, a Largest Contentful Paint (LCP) under 2.5 seconds on mobile is the target. Under 1.8 seconds is good. Above 4 seconds is causing measurable conversion loss. Time to First Byte should be under 600ms. These are measured on a typical mobile connection, not on a fast broadband desktop browser, which is where most founders test their own stores.
Which page speed fix has the highest return for e-commerce?
Image optimisation returns the most per hour of work. Uncompressed and incorrectly sized images are the single most common cause of slow e-commerce pages, and fixing them requires no development work. Compress images, convert to WebP format, implement lazy loading, and size images to the largest they will actually display. This alone can reduce product page weight by 40 to 60% in stores that have not addressed images previously.
Do Shopify apps slow down my store?
Every app installed on a Shopify store adds JavaScript that loads on page requests. Multiple apps can collectively add one to two seconds of script load time. The cumulative effect is significant. Audit your app list regularly. If an app cannot justify its presence with a measurable revenue contribution, remove it. Each removal is a direct speed improvement.
What are Core Web Vitals and why do they matter for e-commerce?
Core Web Vitals are Google's metrics for measuring real-world page experience: Largest Contentful Paint (speed), Cumulative Layout Shift (stability), and Interaction to Next Paint (responsiveness). They became ranking factors in 2024. For e-commerce specifically, CLS is the metric most directly connected to accidental conversion loss: a page that shifts while loading causes misclicks that abandon carts. Fix CLS by setting explicit width and height attributes on all images and embeds.