Last updated:
Every benchmarking report on the internet will tell you the same thing: the average e-commerce conversion rate is 2 to 3%. If you want to know what a good conversion rate for e-commerce looks like for your specific store, that number is almost entirely useless on its own.
Here is the problem. A 2.5% conversion rate is strong for a consumer electronics store. For a grocery delivery platform, it is a red flag. A fashion brand converting at 1.8% on desktop might be doing fine. The same brand at 0.6% on mobile almost certainly has a problem it is not paying attention to.
The number only means something when you add context: which category, which device, which traffic source, which stage of growth. Without that, you are comparing yourself to a blended average that does not represent your business. Here is the context.
What Is a Good E-Commerce Conversion Rate, and What Does the Average Actually Tell You?
Across the industry, conversion rates typically range from 1.5% to 4%, with most stores landing in the 2% to 3% range. The most-cited sources are IRP Commerce, Statista, and the Baymard Institute. They vary a bit depending on how they define and measure conversion, but the range holds.
The more useful way to think about it: if you have more than 10,000 monthly visitors and fewer than 2% are buying, something in your funnel is broken. Not your ads. Not your products. Your conversion flow. Spending more on acquisition to cover that gap is the most expensive way to ignore a fixable problem.
Reference Point Bias: When founders see a benchmark like 2–3%, they immediately anchor on it. At 2.1%, they relax. At 1.8%, they want more traffic. Neither response is necessarily right. The benchmark is a rough orientation, not a report card. What matters is where you sit relative to your specific category, and whether the number is moving in the right direction.
Here is the maths that makes this worth caring about. A store with 50,000 monthly visitors converting at 1.5% gets 750 customers. Improve that to 3%, and you get 1,500 from the same traffic. That is the same revenue impact as doubling your ad budget, without spending an extra dollar.
What Are the Conversion Rate Benchmarks by Category?
Conversion rate benchmarks vary significantly by product category. Fashion typically runs lower, beauty and food run higher, and the upper quartile in any category sits 2-3x above the average. The table below shows the full ranges by category and what the upper quartile looks like when the fundamentals are properly in place. This is the table worth bookmarking.
| Category | Typical Range | Strong Rate | Notes |
|---|---|---|---|
| Food and grocery | 3.0–5.0% | 6%+ | High-frequency, habitual purchase |
| Health and beauty | 2.5–4.0% | 5%+ | Trust-driven; reviews critical |
| Fashion and apparel | 1.5–3.0% | 4%+ | High browse rate; returns affect net rate |
| Consumer electronics | 0.8–1.5% | 2.5%+ | High consideration; price comparison heavy |
| Home and furniture | 0.5–1.2% | 2%+ | Long decision cycles; visualisation matters |
| Sports and outdoors | 1.5–2.5% | 3.5%+ | Seasonal peaks; size/fit queries common |
| Pet supplies | 2.0–3.5% | 5%+ | Repeat purchase; subscription-friendly |
| Jewellery and accessories | 0.8–1.5% | 2.5%+ | High-value consideration; gifting context |
A couple of things are worth flagging here. Food and grocery stores sit at the top because people buying groceries already know what they want. The store's job is mostly to stay out of the way. Electronics and furniture sit at the bottom because people spend days or weeks researching before they buy. They visit, leave, come back, compare, and return again. A single-session conversion rate does not capture that full loop.
This matters because if you sell furniture and convert at 1.1%, that is not a crisis. If you sell pet food and you are at 1.1%, that is a serious problem. Same number, completely different story.
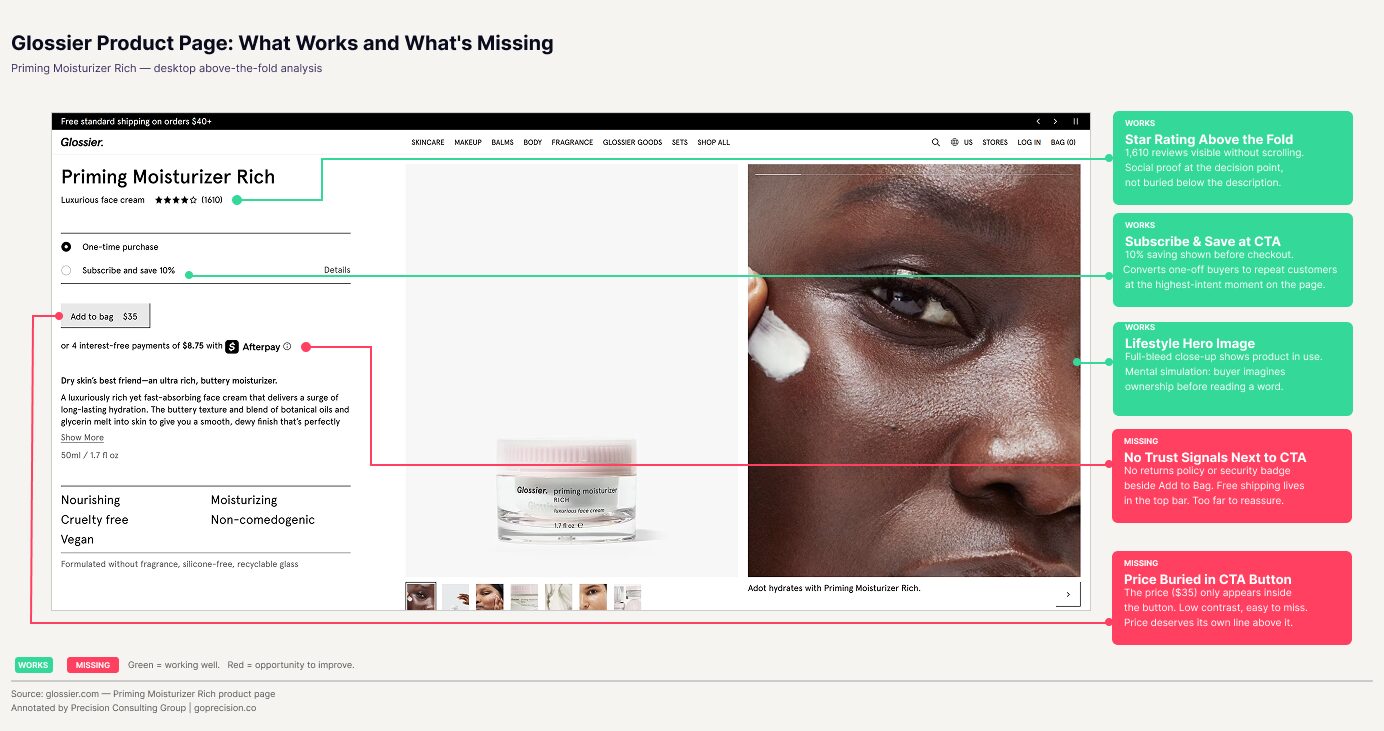
Glossier product page: what works and what is missing. Green = working well. Red = opportunity to improve.
Why Does the Desktop vs. Mobile Split Matter More Than Most Founders Realise?
The desktop vs mobile split matters because a healthy blended rate often hides a broken mobile experience. Desktop typically converts 2-3x mobile. A 2.5% blended rate can be 3.8% desktop and 1.1% mobile, and the mobile gap is where most of the recoverable revenue is sitting. Here is a pattern that comes up constantly in our work at Precision. A founder reviews their analytics, sees a conversion rate of around 2.5%, and feels comfortable. Then we split it by device. Desktop is converting at 3.8%. Mobile is at 1.1%.
The blended number looked fine. The mobile number is a revenue problem. Most stores get more than half their traffic on mobile. Most stores convert at two to three times the rate on desktop. Put those two facts together, and you have a business that is spending significant money to send visitors to an experience that loses the majority of them.
Cognitive Load Theory: Mobile users are juggling more than desktop users. Smaller screen, worse keyboard, background notifications, slower connections. Every extra tap, every form field that does not auto-fill, every image that takes too long to load adds to that load. When cognitive load gets too high, the brain defaults to the easiest option: leaving. On mobile, that means a closed tab and an abandoned session.
A simple benchmark: if your mobile conversion rate is below 60% of your desktop rate, mobile is almost certainly your highest-leverage CRO priority. Not a new product launch. Not a bigger ad budget. Just a checkout flow that works properly on a phone.
The mobile CRO article covers exactly what a purpose-built mobile experience looks like and which friction points to fix first.
How Does Your Traffic Source Affect Your Conversion Rate?
Your conversion rate is not just a reflection of your site quality. It is heavily shaped by the intent level of the people arriving. High-intent traffic converts at dramatically higher rates than broad awareness traffic, and if your acquisition mix has shifted recently, that alone can explain a drop in your blended rate.
- Email to existing customers typically converts at 3–8%, sometimes higher for well-segmented lists
- Branded search and direct traffic: 2.5–4%
- Organic non-branded search: 1.5–3%, depending on keyword intent
- Paid social and display: often under 1%, as these reach people who were not actively looking
That means a store that has shifted its acquisition mix toward paid social will show a lower blended conversion rate than it did six months ago, even if the site has gotten better. If your rate dropped and you cannot find a site change that explains it, check your traffic source breakdown first.
Segment your conversion rate by traffic source in your analytics. If email converts at 4% and paid social converts at 0.6%, those are two separate problems that need two separate approaches. Lumping them into a single number and trying to fix both with one change is how CRO stalls.
What Are the Most Common Reasons Your Conversion Rate Is Below Benchmark?
The most common reasons your conversion rate is below benchmark are: a weak product page, trust signals in the wrong place, too many checkout steps, late delivery cost reveal, mobile built as an afterthought, slow page speed, and pricing without a reference point. Between them, these seven issues account for the majority of fixable conversion problems across the stores we audit. If you are below your category average and not sure why, work through this list.
1. Your product page is not doing its job
This is where most buying decisions get made, and most buying decisions get lost. If your hero image is a product on a white background, your headline leads with a model number, and your reviews are below the fold, you are losing sales that your ads already paid for. The product page design article covers the eight elements that move this number the most.
2. Trust signals are in the wrong place
Security badges, returns policy, and payment logos. Most stores have them. They are in the footer. That is too late. A customer deciding whether to click Add to Cart is not scrolling to your footer. Trust signals belong at the point of decision, right next to the button.
3. Your checkout has too many steps
Baymard Institute's research across thousands of e-commerce sites found that the average checkout has 14.88 form fields. The optimal is around 7. Guest checkout is unavailable on 20% of major sites. Every unnecessary step is a decision point, and every decision point is a chance to lose someone who was ready to buy.
4. The delivery cost appears too late
According to Baymard Institute, 67% of cart abandonment is driven by unexpected costs at checkout. Customers who hit a surprise shipping cost at the final step do not adjust. They leave. If you charge for delivery, show it early, ideally on the product page itself. If you have a free shipping threshold, show the gap on the cart page. Do not let checkout be where they find out.
5. Mobile was designed as an afterthought
A desktop site that technically renders on mobile is not a mobile experience. Tap targets too small to hit without zooming. Forms that bring up the wrong keyboard. Images that take four seconds to load on a 4G connection. Each one is its own barrier. Hit two or three in a row, and completing the purchase feels like more trouble than it is worth. Most mobile visitors quietly decide it is not worth it and leave.
6. Your pages are too slow
According to Google research, 53% of mobile visitors leave a page that takes more than three seconds to load, and a one-second delay reduces conversion by 7%. These are not edge case numbers. Page speed is a conversion lever, and for most stores the biggest culprits are uncompressed images and third-party scripts that were added and never cleaned up.
7. Your pricing does not give the brain a reference point
The problem is not full-price products. The problem is discounted products where the original price is not displayed, or bundles where individual item values are not shown. £89 with no context just sits there. £89, down from £120, tells a story. A bundle at £65 with no indication that the individual items would cost £94 separately leaves value on the table.
If you run promotions, show the original price. If you sell bundles, show the individual component costs. Without a reference, the brain has no way to evaluate whether the deal is real. It defaults to scepticism. The psychology of pricing article covers exactly how to frame this.
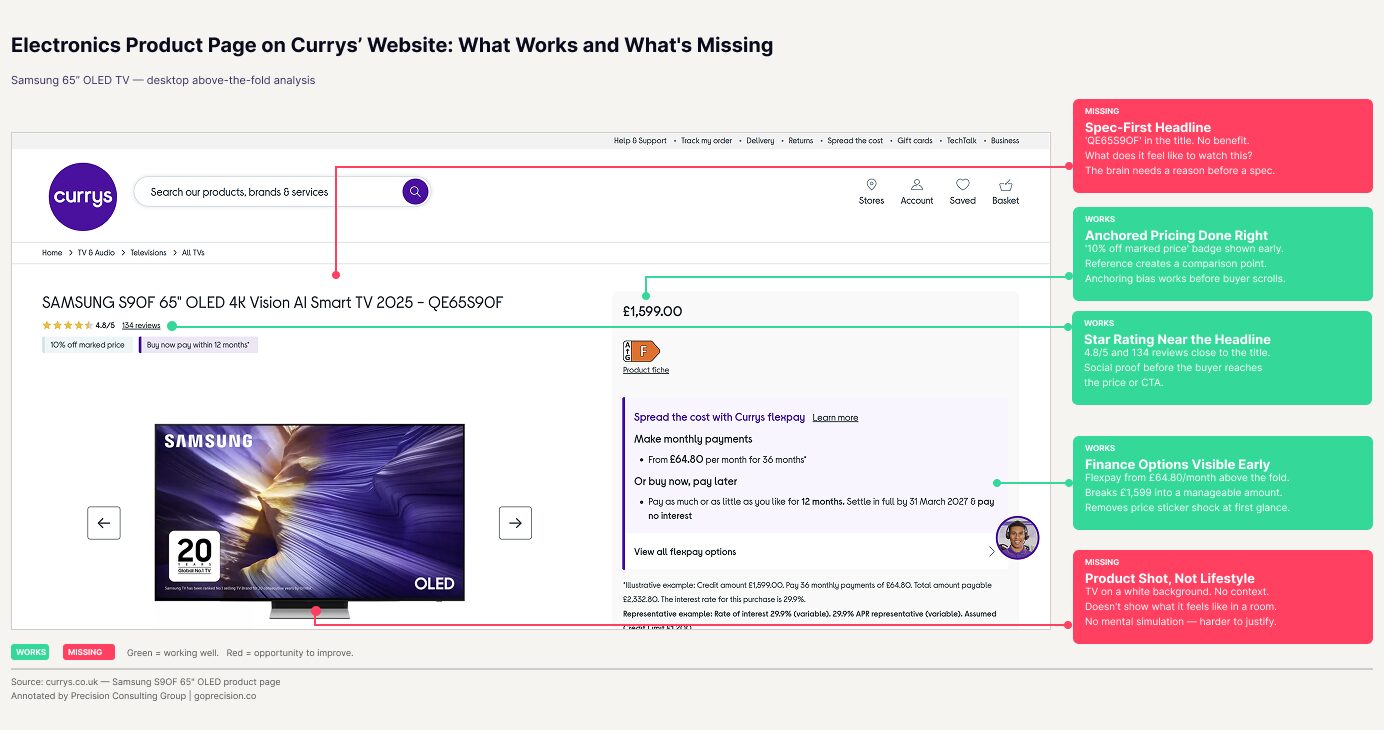
Currys product page: what works and what is missing. Green = working well. Red = opportunity to improve.
This is the kind of analysis we run in a Precision Deep Dive Audit. If you want to see exactly where your store is leaking revenue, request your free audit and we will walk through it together.
How Do You Set a Conversion Rate Target That Actually Means Something?
Set your conversion rate target by anchoring on your category benchmark and your current device split, not on a round number like 3% that sounds good. Most conversion rate goals are set the wrong way. Someone picks 3% because it sounds like a good number. They run some changes. The blended rate moves from 1.8% to 2.1%, and they are not sure whether that is good. Here is a better structure.
Start with your category benchmark. Find the typical range and the upper quartile for your product type. Then segment: set separate targets for mobile and desktop. Set separate baselines by traffic source. A blended target hides which segment is dragging you down and makes it almost impossible to know whether your changes are working.
Then set a horizon. Structural CRO changes (checkout redesign, product page rebuild, mobile optimisation) take four to eight weeks to test properly. If you are expecting results in a week, you will pull the plug too early and miss the signal in the noise.
A grounded target structure: if you are currently at 1.5% and your category upper quartile is 3.5%, set a six-month goal to hit 2.5%. That is a 50% improvement on your current rate. Ambitious but achievable, and specific enough to hold yourself accountable.
Do not optimise a blended rate. Segment by device, by traffic source, and by new versus returning visitor first. The segment with the biggest gap to benchmark is where you start. The CRO audit checklist is the right starting point for identifying which fixes will close that gap fastest.
Key Takeaways
- The 2–3% industry average is orientation, not a benchmark. Category, device, and traffic source all change what good actually looks like for your store.
- Food and grocery converts at 3–5%. Consumer electronics at 0.8–1.5%. The same rate can mean success in one category and a serious problem in another.
- If your mobile conversion rate is below 60% of your desktop rate, mobile is your biggest lever. Not more traffic. Not more products.
- Check your traffic mix before blaming the site. A shift toward paid social will drop your blended rate even if nothing on the site has changed.
- The seven most common fixable causes: product page quality, trust signal placement, checkout friction, hidden delivery costs, poor mobile experience, slow pages, and unframed pricing.
- Set targets by segment, not by blended average. Six-month goal: close 50% of the gap between your current rate and your category upper quartile.
Frequently Asked Questions
What is the average e-commerce conversion rate?
Across the industry, the average is between 2 and 3% for desktop traffic. Mobile is typically lower, at around 1–1.5% across most categories. These numbers vary widely by category: grocery and food delivery can reach 5% or higher, while furniture and high-consideration electronics often sit below 1%. The average gives you a rough idea of where most stores are. Your category benchmark tells you where you should be.
Is a 1% conversion rate bad?
Depends entirely on the category and device. For mobile consumer electronics, 1% is close to average. For a health and beauty store on desktop, 1% is well below the benchmark and points to fixable problems. Before you decide whether a number is bad, compare it against your specific category and split by device and traffic source. Context is everything.
How do I calculate my conversion rate?
Divide completed transactions by total sessions, then multiply by 100. 50,000 sessions and 750 purchases give you 1.5%. Use sessions rather than unique users for a more accurate picture, since one person can generate multiple sessions across a decision cycle.
Why is my conversion rate lower on mobile than on desktop?
Most mobile experiences were designed as scaled-down versions of desktop sites rather than purpose-built for phones. Smaller tap targets, forms that do not behave on touch, slower load times, and more environmental distractions all add up. Mobile visitors are no less willing to buy. They are more likely to hit friction that makes buying harder than leaving.
Can I improve my conversion rate without more traffic?
Yes, and for most stores that is exactly where to start. If your site converts at 1.5%, getting to 3% doubles your revenue from the same traffic. No extra ad spend. No new products. Just the same visitors converting at a higher rate. The fastest way to identify which friction points to tackle first is to audit the funnel by traffic source and device, then fix the segment with the biggest gap to benchmark.
Predictably Irrational by Dan Ariely covers anchoring and reference-point bias, which is directly applicable to how customers interpret pricing and benchmarks. Robert Cialdini's Influence explains social proof mechanisms, which are relevant to why review count and placement affect conversion rates the way they do.
Want to know where your store stands against your category benchmark? See how Precision works with e-commerce brands, or book a strategy session for a personalised assessment of your conversion rate gaps.