Last updated:
The Conversion Accelerator Framework is Precision's approach to systematic conversion rate optimisation, built around five phases: Diagnose, Prioritise, Test, Implement, and Compound. Each phase has a specific purpose and a defined output. Together they create a programme that produces compounding results rather than isolated wins.
The founders who come to us frustrated with CRO are almost never frustrated with the wrong thing. They ran tests. The results were inconclusive. They ran more. Still nothing moved. They gave up and went back to ad spend. What they were missing was not a better test. It was a reason for the test.
The problem is not the testing. It is what comes before the testing. Most CRO programmes start by asking what they should test. The Conversion Accelerator Framework starts by asking what is actually causing buyers to leave. That question first. Then the tests.
Precision runs the Conversion Accelerator as a structured ongoing programme. See how it works before deciding whether it is the right approach for your business at this stage.
Why systematic CRO outperforms ad hoc testing
A doctor does not walk in and start prescribing. They ask questions, run tests, look at the data, and build a picture of what is actually wrong. The prescription follows the diagnosis. This sounds obvious because in medicine we would never accept anything else.
CRO is the same. But most programmes skip the diagnosis entirely. A founder reads that exit-intent popups improve conversion. Installs one. Nothing moves. They read that social proof increases confidence. Adds more reviews. Still nothing. Months pass. Nobody looked at what was actually causing visitors to leave. The interventions were fine. The problem identification was not.
A systematic programme goes in the other order. Find where buyers are dropping off. Understand why. Build a specific intervention aimed at that specific friction. Test it. Implement what works. Repeat. The tests cost the same either way. The difference is how many of them produce results.
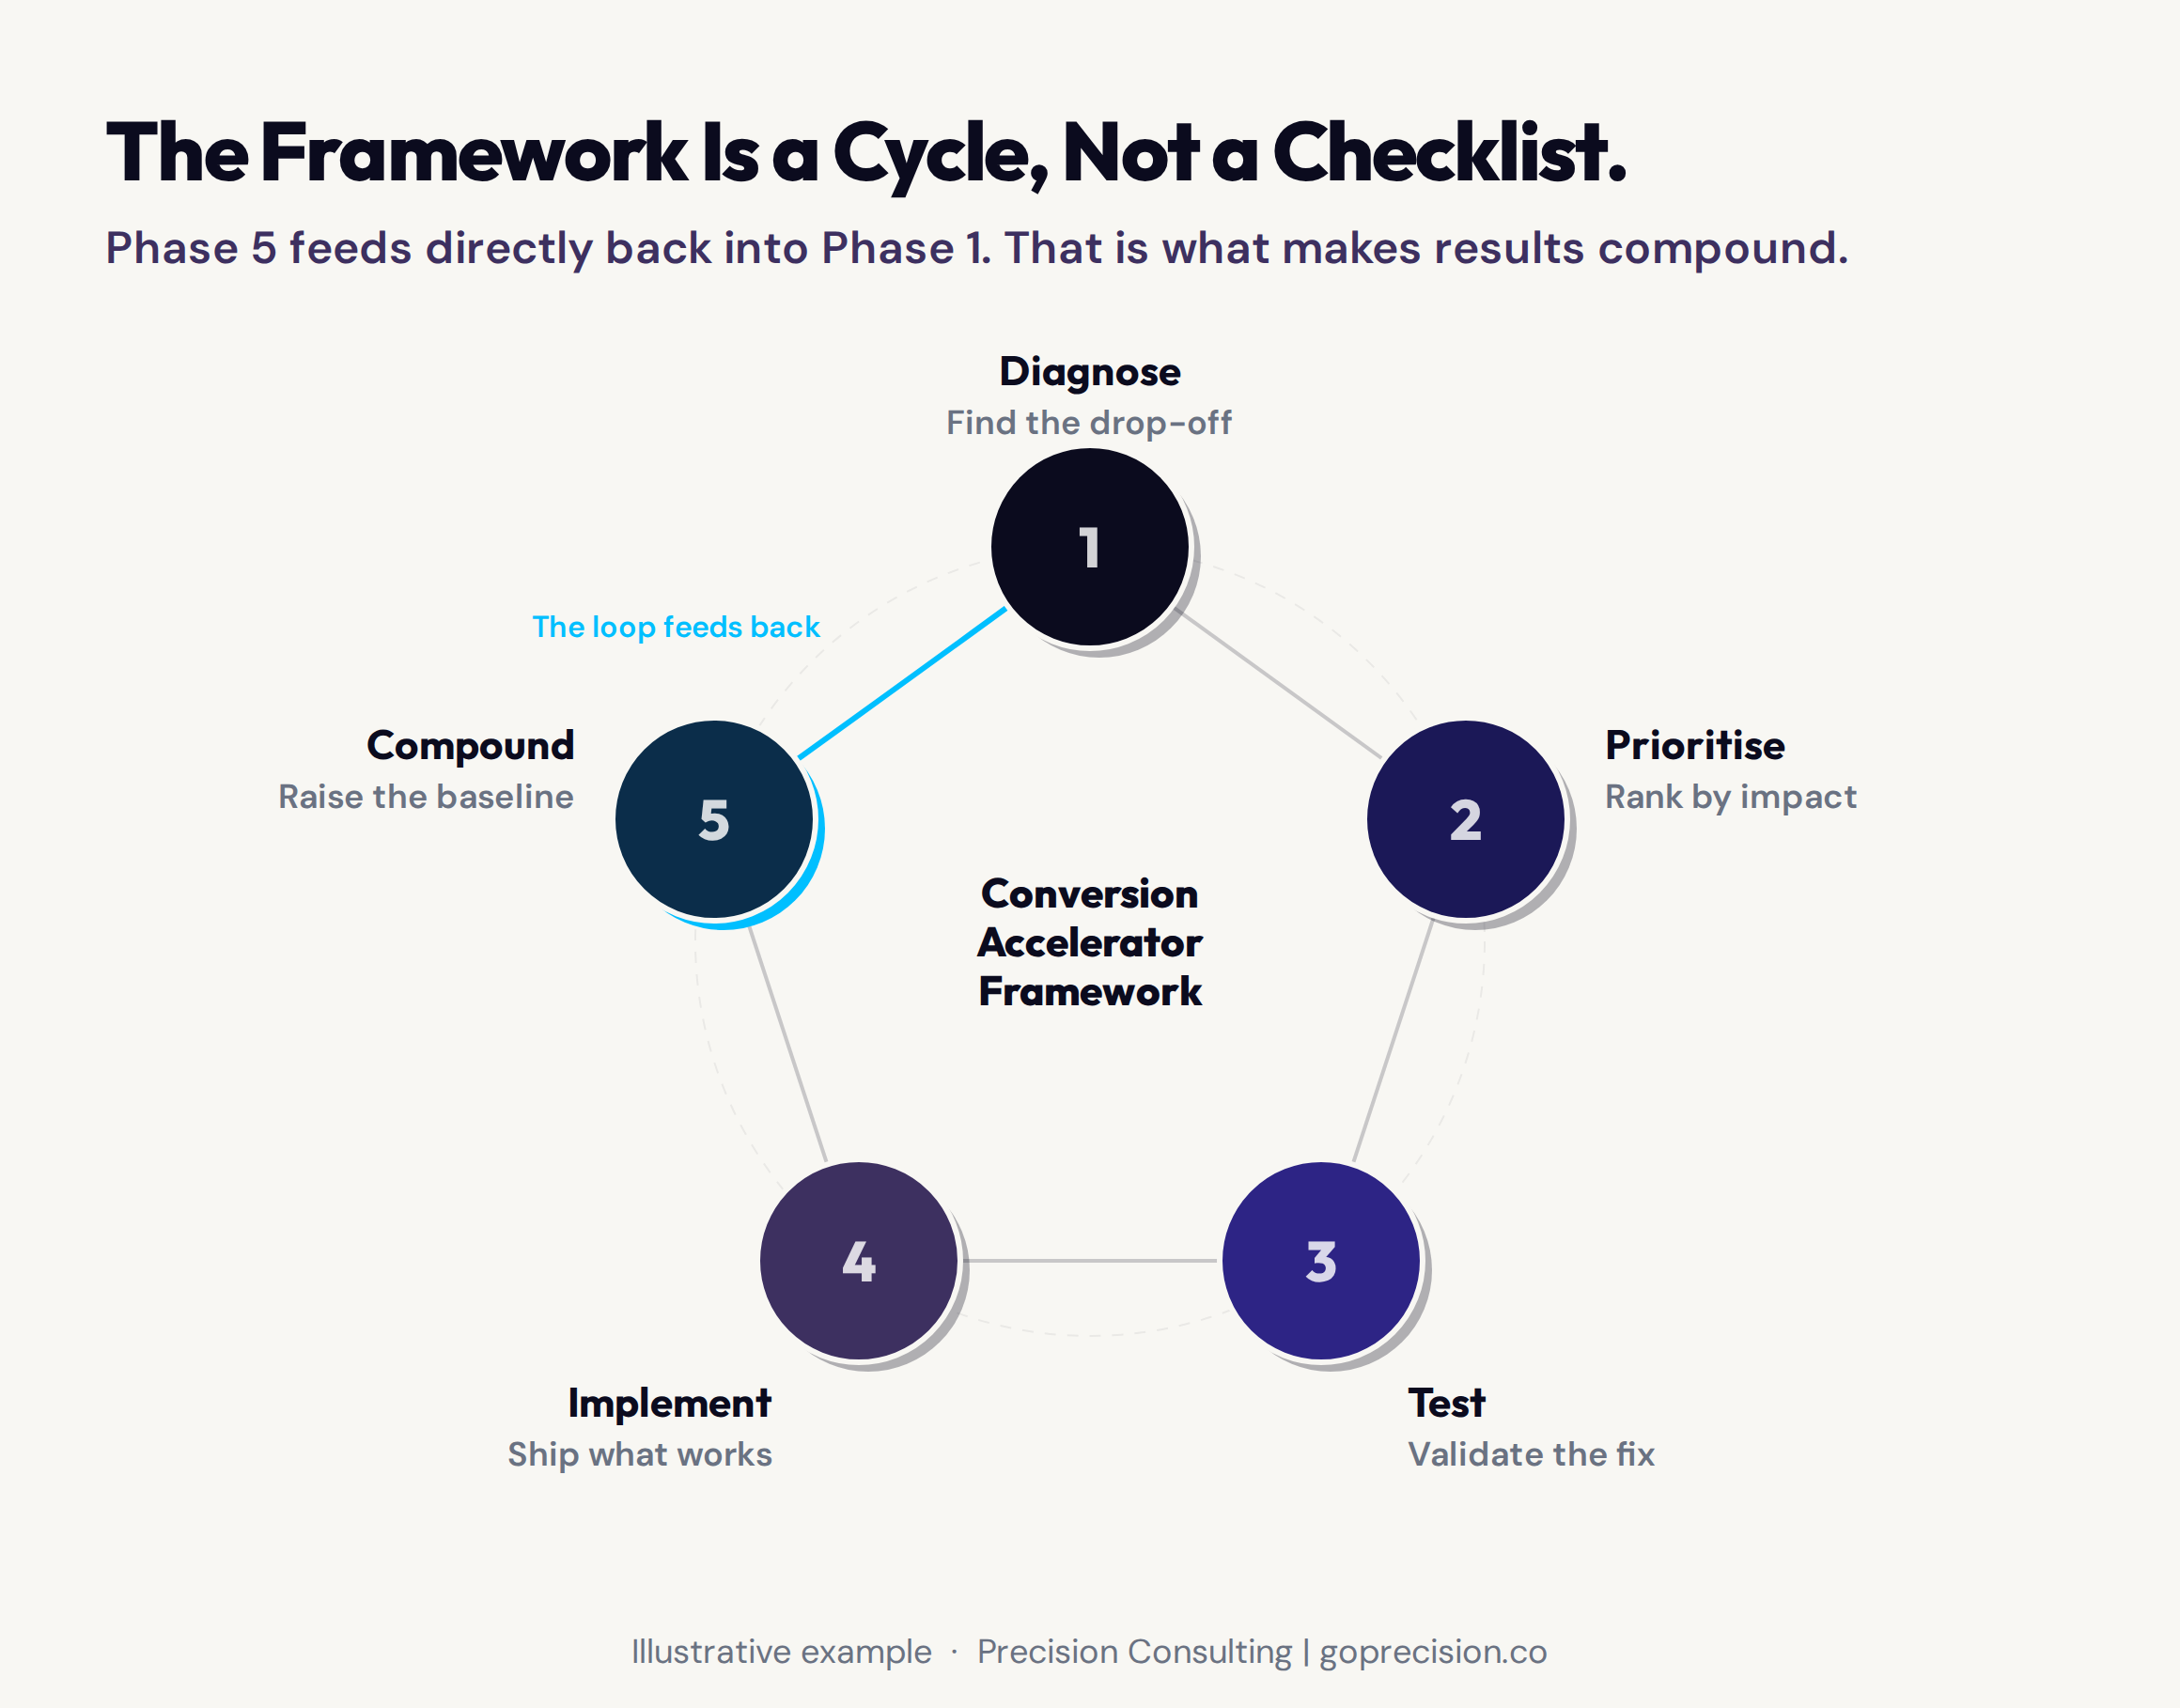
The framework is a connected system, not a checklist. Each phase produces an output that the next phase requires.
Goal Gradient Effect: Humans move faster toward a goal when they can see how far they have left to go. A structured five-phase framework does this for CRO: when you can see exactly which phase you are in and what comes next, execution stops feeling abstract and starts feeling achievable.
Phase 1: Where the diagnosis starts
Every Precision engagement starts the same way. Not with a list of things to test. Not with recommendations. With a question: where are buyers leaving, and why?
That sounds simple. Most stores have never actually answered it. They know their headline conversion rate. They do not know which specific step in the funnel is costing them the most. That is what the diagnosis finds.
What the funnel data shows that the headline rate does not
The starting point is your analytics, and the question is simple: at which step are the most buyers leaving? Not your overall conversion rate. The step-by-step funnel. Landing page to product page. Product page to cart. Cart to checkout. Checkout to completion. Each transition has a conversion rate. The one with the biggest unexplained drop is where we start.
Most stores have never mapped this in any detail. They know their overall rate. They do not know that their mobile add-to-cart rate is half their desktop rate, or that one category is dragging the whole store down. That level of detail is not visible in the headline numbers. It is visible in the funnel, and it tells you where to look next. A thorough CRO audit checklist maps exactly these funnel transitions before any testing resource is committed.
Why session recordings reveal what funnel data cannot
Numbers tell you where. Session recordings tell you why. Once the funnel data points to a specific step, we watch recordings of real buyers moving through that exact step. Not a general sample. The specific page or interaction where the data said buyers are leaving. The full breakdown of heatmaps versus session recordings covers what each tool shows and where they overlap.
What you are looking for is the pattern that shows up repeatedly. Buyers scrolling past the add-to-cart button and leaving. Buyers entering their shipping details and abandoning when the cost appears. Buyers clicking somewhere that does not do what they expected. Any behaviour that appears consistently across recordings is worth investigating. One buyer doing something odd is noise. Ten buyers doing the same thing is a signal.
Phase 2: How prioritisation focuses the programme
Diagnosis surfaces more problems than any programme can fix at once. That is a good thing. It means you have choices. Prioritisation is how you decide which problems are worth your time and which ones need more evidence before you act.
The two things that matter: how much impact will fixing this have, and how confident are you in the diagnosis? High on both go first. If you are not confident in what you found, do not build a test around it yet.
The ICE model and its limitations
Many CRO programmes use ICE scoring: Impact, Confidence, Ease. Each factor is rated, the scores are multiplied, and the highest-scoring items get tested first. It is a reasonable starting structure, but it has a failure mode.
ICE scoring tends to surface easy wins disproportionately. If ease is weighted equally with impact, a low-impact fix that is quick to implement scores as highly as a high-impact fix that requires development. Six months of easy wins can produce a long list of completed tests and negligible conversion improvement. The store looks active. Nothing has changed.
We modify the model to weight impact and confidence more heavily than ease. The question is not what can we do quickly, but what is most likely to move conversion materially if we address it. That often means addressing harder problems earlier rather than stacking quick fixes that produce noise rather than signal.
The distinction between direct fixes and tests
Not every friction point identified in diagnosis requires a controlled test. Some findings are clear enough to act on directly. A broken mobile navigation. A product description that does not answer the most common buyer question. A checkout that asks for account creation before showing the order total.
These are not hypotheses. They are clear problems with clear solutions. Treating them as tests wastes the statistical runway and delays the improvement. We categorise findings into direct fixes and tests at the prioritisation stage, and resource them separately.
Before starting any test, watch twenty session recordings on the page you plan to test. Not ten. Twenty. The patterns that matter are the ones that appear repeatedly, not the outliers. If you cannot identify a specific recurring behaviour in twenty recordings, the hypothesis for your test is likely incomplete.
Phase 3: What makes a test worth running
Testing is where most CRO conversations start. It is Phase 3 in the Conversion Accelerator Framework because the value of a test is entirely determined by the quality of the hypothesis going in.
A good test starts with a specific hypothesis: not what if we change the button colour, but buyers are abandoning because the CTA is below the fold on mobile, so we are testing moving it up. One change. One measurement. A clean environment where nothing else shifts. Most inconclusive tests lack one of these. Usually the hypothesis. For a full breakdown of how to run tests that reach reliable conclusions, the guide to A/B testing for founders covers sample size, confidence thresholds, and when to call a result.
How long does a test actually need to run?
Longer than most people want it to. A test needs enough visitors to both variants to be confident that what you are seeing is real, not just random noise. The specific number depends on your traffic and your current conversion rate, but the general rule is: if you are tempted to call it early because the results look good, wait.
Founders who call tests at 60% confidence and implement the winning variant often watch conversion drop afterwards. The test was telling them something, but it was not telling them enough yet. Define how long the test needs to run before you start it, then run it that long. If it is inconclusive, that is information too.
For stores with lower traffic, traditional A/B testing becomes impractical because tests take too long to reach any meaningful confidence. In those cases, we shift to implementing well-evidenced direct fixes and measuring the before/after across a long window. Less rigorous, but considerably better than guessing.
Multi-variate or A/B: which approach produces faster results
The temptation with a long prioritised list of hypotheses is to test several things at once using multi-variate testing. The logic is appealing: you can learn more, faster, by testing more simultaneously.
The problem is traffic. A multi-variate test splits your visitors across multiple combinations simultaneously. Each combination needs enough visitors to reach significance on its own. What sounds like running more tests faster usually means none of them reach significance at all. Run tests sequentially. One thing at a time. The learning stacks faster.
Multi-variate testing makes sense when traffic is very high (100,000+ monthly sessions on the test page), and the hypothesis specifically requires understanding the interaction effects between variables. For most businesses, sequential A/B testing produces better results faster because it keeps the attribution clean.
Loss Aversion: When a test is winning, the instinct is to call it early before the result can flip. That instinct kills more CRO programmes than inconclusive results do. A test stopped at 70% confidence is not a win. It is a guess dressed as a win. Set your confidence threshold before you start, then hold it.
Phase 4: How implementation determines whether results hold
A test that reaches statistical significance is not an instruction to implement. It is an instruction to evaluate.
Evaluation means asking three questions before implementing a winning variant. Is the improvement statistically significant at the required confidence level? Is the improvement commercially significant, meaning does the lift in the metric translate to a meaningful revenue impact at current traffic levels? And does the change create any downstream effects that the test did not measure?
The third question is the one most frequently missed. A change to a product page that improves add-to-cart rate might decrease return rate if it changes how buyers understand the product. An improvement in checkout initiation rate might be accompanied by a change in average order value that the test was not designed to detect. Winning on the primary metric while losing on an unmeasured secondary metric is a real risk, and it is worth a thorough review before permanent implementation.
The implementation quality problem
One of the most consistent sources of CRO disappointment is the gap between the tested variant and the implemented one. A test runs in a tool like VWO or Optimizely using injected JavaScript. The result is significant. The change gets handed to development to implement natively. The native implementation looks slightly different from the tested variant, it loads at a different point in the page lifecycle, or a detail of the copy or design changes in the handoff.
The measured lift does not fully materialise. The programme gets blamed for producing results that do not hold. The actual problem was implementation quality, not the test.
We address this by documenting the tested variant with pixel-level specificity before handoff: exact copy, exact colour values, exact positioning, exact interaction behaviour. The implemented version is checked against this documentation before the test is closed. The difference in outcome is significant.
This is the kind of analysis we run in a Precision Deep Dive Audit. If you want to see exactly where your funnel is leaking revenue, request your free audit and we will walk through it together.
After implementing a winning variant, measure the metric it was designed to improve for four weeks using the same analytics setup as the test. If the improvement does not materialise, the issue is almost always implementation variance. Compare the live implementation to the test variant documentation before looking for any other explanation.
Phase 5: What compounding does over twelve months
Compounding is what separates a CRO programme from a set of CRO projects.
Each improvement raises the floor that the next improvement builds on. You are not testing the next change against your original conversion rate. You are testing it against a better one. The same percentage lift on a higher baseline produces more revenue. That is the mechanic. It does not feel dramatic in month two. It is very visible in month ten.
Think of it like compound interest. The early returns look modest. The later returns, applied to a progressively higher principal, look different. A twelve-month systematic programme does not produce twelve months of small wins. It produces a curve.
How the feedback loop improves the next cycle
Phase 5 feeds back into Phase 1. Every implemented change, and every failed test, produces data that improves the diagnostic quality of the next diagnostic cycle. A test that did not move conversion is not a failure. It is information: the hypothesis was wrong, the friction point was real, but the intervention was not correct, or the friction point was less impactful than estimated.
A programme that treats failed tests as data gets progressively better at designing the next test. After twelve months, the hypotheses going into tests are sharper, the confidence in the diagnosis is higher, and the hit rate on tests is meaningfully better than it was at the start. That is the compounding effect on the thinking side, not just the conversion side.
When to restart from Phase 1
A common question is how often to run a full diagnostic. The answer is: whenever the data stops making sense. A significant drop in a metric that the programme cannot explain is a signal to go back to diagnosis rather than pushing the prioritised list forward. A major traffic composition change, a platform update, a product line change, or a seasonal shift can all make the existing prioritised list partially or wholly invalid.
We typically run a full diagnostic at programme start and a lighter re-diagnostic every three months, with a trigger for unscheduled re-diagnosis if any metric moves materially and unexpectedly. The programme is designed to be responsive to the data, not to run on a fixed plan that does not adapt to what the data is showing.
What the framework produces in practice
A store running a systematic programme through the Conversion Accelerator Framework for twelve months typically sees a different pattern from one running ad hoc tests.
In the first three months, the most visible output is often direct fixes rather than test results. These are the clear friction points that did not need validation: the broken mobile navigation, the missing size guide, the checkout that required account creation before the buyer could see their order total. The conversion improvement from these fixes is real but is difficult to attribute to any single change.
Between months three and six, the first statistically significant test results come through. By this point, the diagnostic has been run properly, and the tests are addressing hypotheses with real evidence behind them. Each one produces a validated improvement, or a validated null result that updates the hypothesis list. Between months six and twelve, the compounding becomes visible. At 30,000 monthly sessions and a $65 average order value, a 0.6 percentage point conversion improvement represents an additional $11,700 per month. No new traffic. No new ad spend. No new products. Only the funnel.
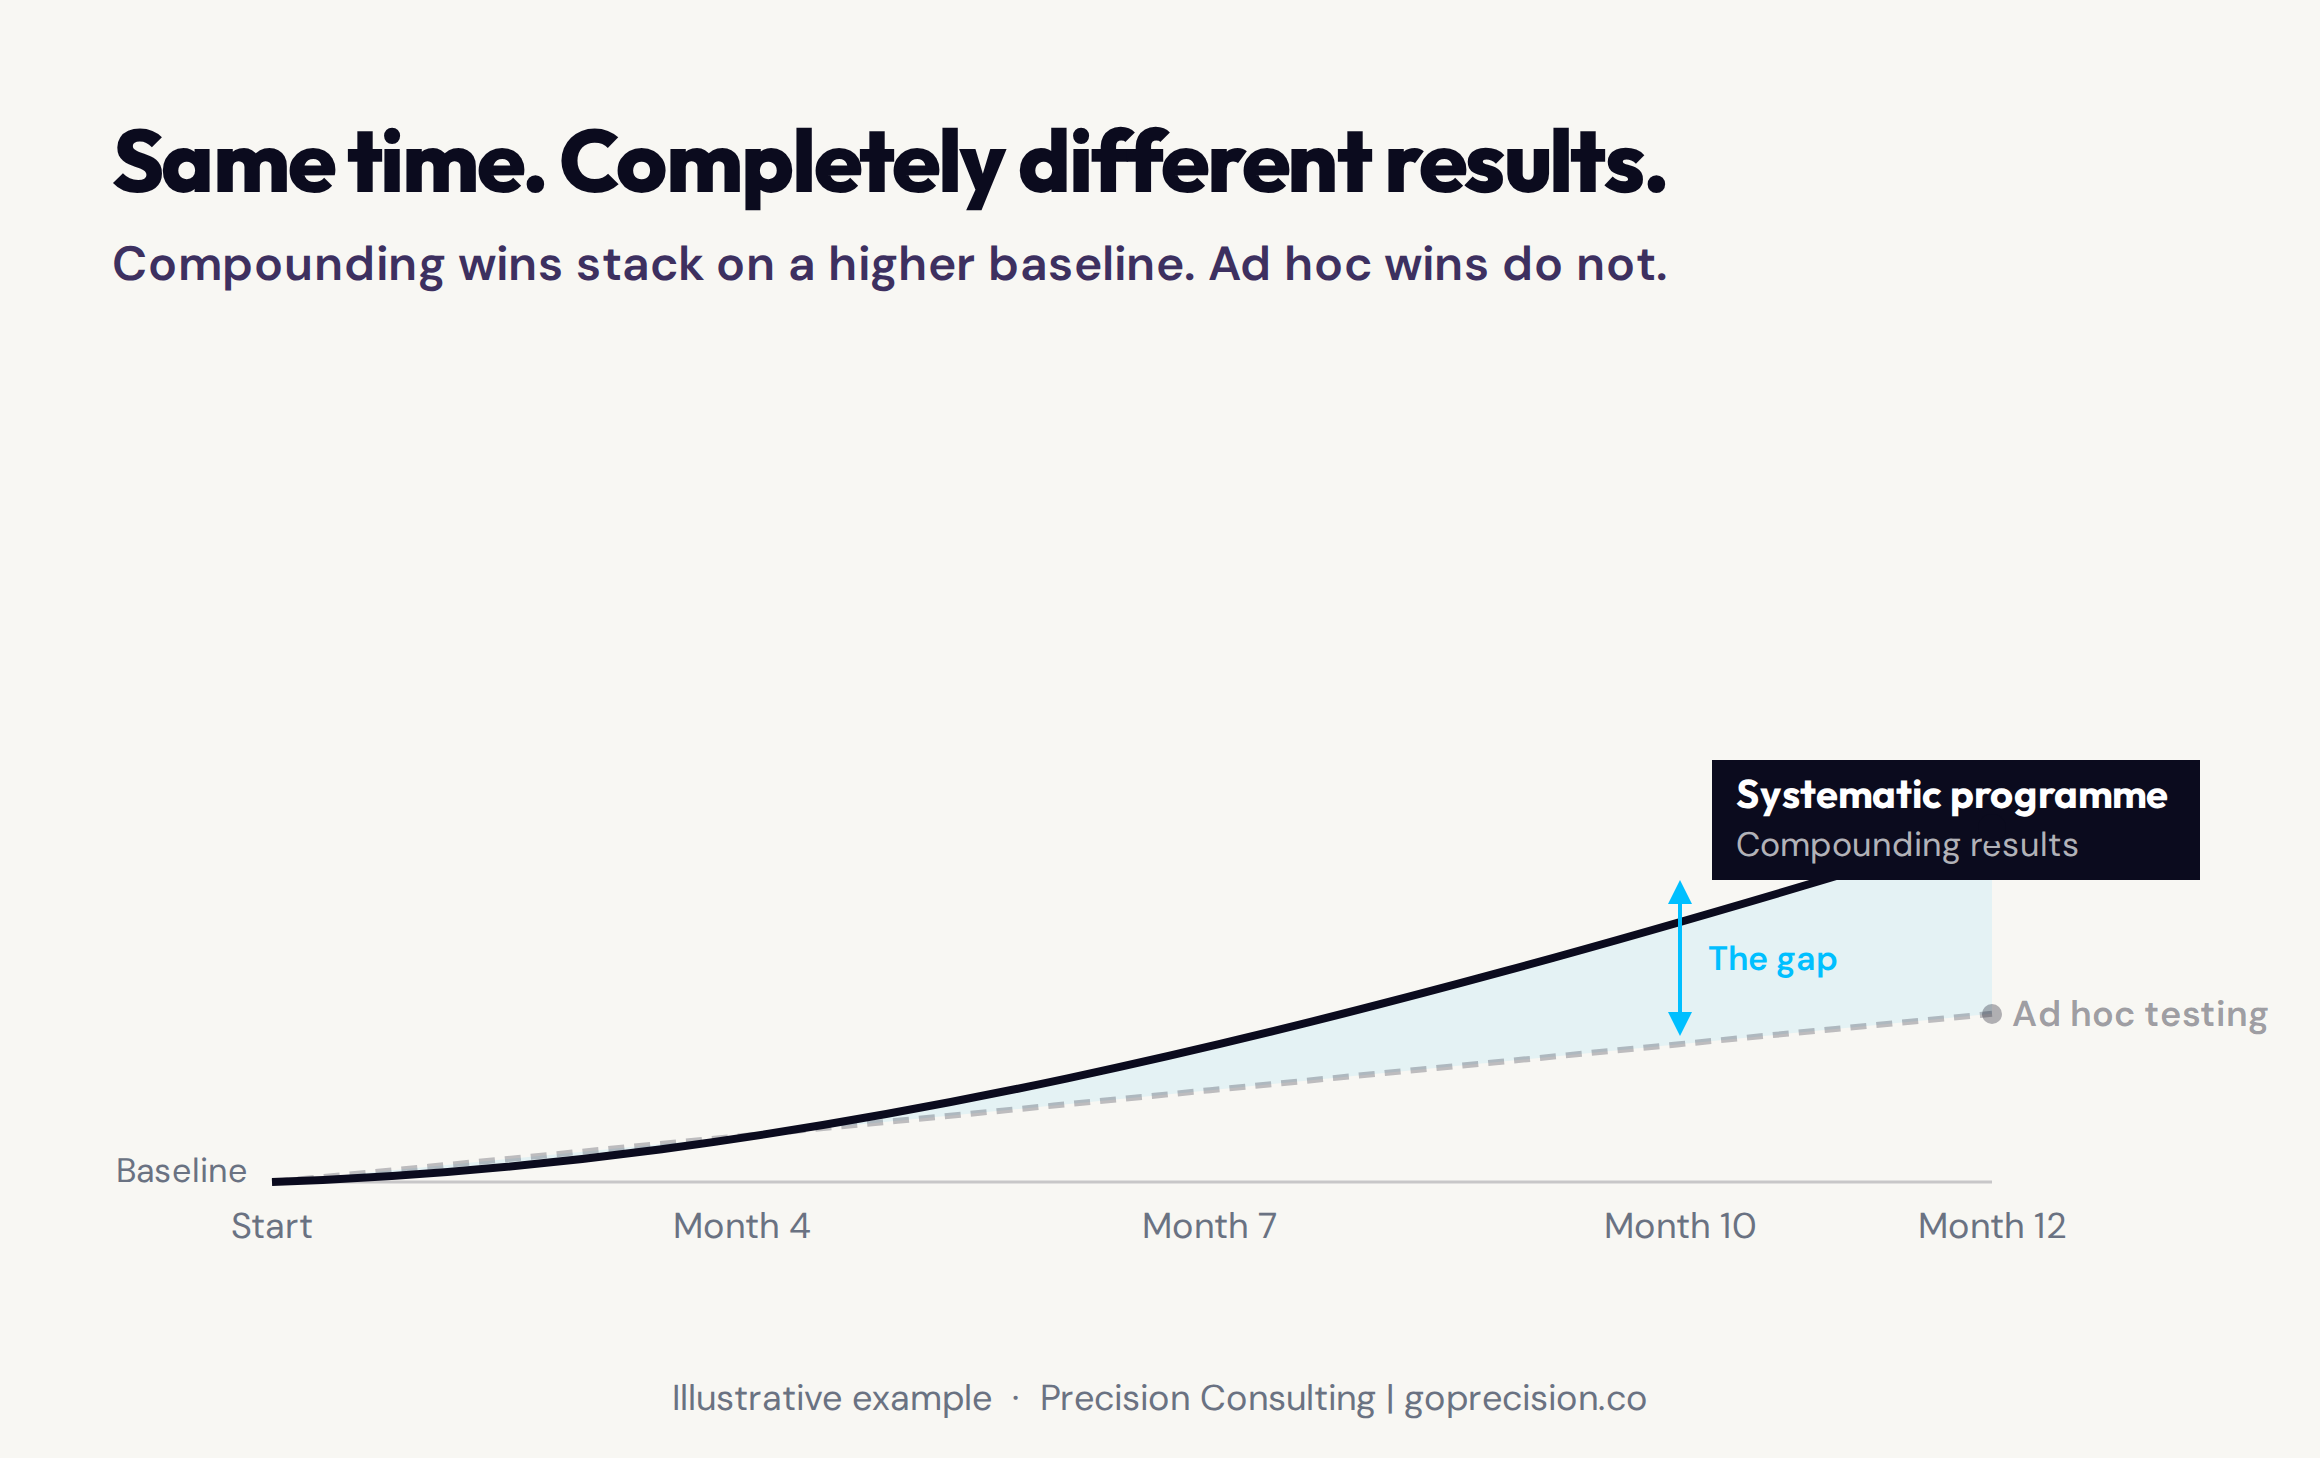
What twelve months of systematic work produces: a compounding curve, not a flat line of disconnected wins.
If you want to understand how the Conversion Accelerator runs as a structured engagement, see how Precision structures the programme and what each phase produces in a real client context. Or book a free strategy call to walk through where your current funnel sits in the framework.
Predictably Irrational by Dan Ariely covers the psychological mechanisms that drive buyer behaviour in ways that are not visible in analytics. Don't Make Me Think by Steve Krug provides the practical framework for identifying usability-level friction in the qualitative diagnostic phase. Influence by Robert Cialdini covers the six principles of persuasion, all of which are testable at specific funnel steps.
Key Takeaways
- The Conversion Accelerator Framework is a five-phase process: Diagnose, Prioritise, Test, Implement, and Compound. The sequence matters. Testing before diagnosis produces answers to the wrong questions.
- Phase 1 (Diagnose) has two layers: quantitative (funnel data to locate the drop-off) and qualitative (session recordings and surveys to understand why). Both are necessary. Neither is sufficient alone.
- Prioritisation should weight impact and confidence more heavily than ease. Easy wins stack up quickly. High-impact wins move conversion. A programme built on easy wins looks active and produces noise rather than signal.
- Not every friction point requires a test. Clear problems with clear solutions should be implemented directly. Tests are for decisions where the right answer is genuinely uncertain.
- Statistical significance requires patience. A test called at 60% confidence is worse than no test because it produces confident but unreliable data. Define the required confidence level before the test starts and run to it.
- Implementation quality determines whether a test result holds in production. Document the tested variant with precision before handoff and validate the implementation against that documentation before closing the test.
- Compounding is what makes a programme more valuable than a set of projects. The impact of each improvement is applied against the improved baseline from all previous improvements. Twelve months of systematic work produces a materially better result than twelve months of the same test run in isolation.
Frequently Asked Questions
What is a CRO framework?
A CRO framework is a structured process for systematically improving conversion rates. Rather than running isolated tests based on intuition or industry best practices, a framework begins with a structured diagnosis, establishes evidence-based hypotheses, runs controlled tests, implements validated improvements, and creates a feedback loop that compounds results over time. The Conversion Accelerator Framework is a five-phase structure: Diagnose, Prioritise, Test, Implement, and Compound.
How long does it take to see results from a CRO programme?
Most well-structured programmes produce initial direct-fix improvements in the first four to six weeks. The first statistically significant test results typically arrive between weeks six and twelve, depending on traffic volume. Meaningful compounding improvement becomes visible between months three and six. A programme running for twelve months with consistent execution typically shows 0.5 to 1.0 percentage points of conversion improvement from the starting baseline, with ongoing gains continuing after that.
How is the Conversion Accelerator Framework different from standard CRO?
The primary difference is the weight placed on diagnosis before testing. Standard CRO approaches often begin with a prioritised list of recommended changes based on industry benchmarks or heuristic audits. The Conversion Accelerator Framework begins with a structured quantitative and qualitative diagnostic that identifies the specific friction points in your funnel before any testing resource is committed. This means tests are designed to validate specific, evidenced hypotheses rather than to test generic best practices.
What traffic volume do I need to run CRO tests?
The minimum viable traffic volume for standard A/B testing is approximately 10,000 monthly visitors to the page being tested, assuming a conversion rate of around 2% and a minimum detectable effect of 15%. Below that threshold, tests take prohibitively long to reach significance. For businesses with lower traffic, the programme shifts toward direct implementation of well-evidenced changes with pre/post measurement rather than controlled tests.
What is the difference between A/B testing and multi-variate testing?
An A/B test changes one variable and compares two variants: the control and the variant. A multi-variate test changes multiple variables simultaneously and measures the performance of all combinations. A/B testing requires less traffic to reach significance and produces cleaner attribution. Multi-variate testing can be efficient at very high traffic volumes where understanding interaction effects between variables is important. For most businesses, sequential A/B testing produces faster, more actionable results.
What happens when a CRO test produces no result?
An inconclusive or null result from a well-designed test is valuable information. It tells you that the hypothesis was either wrong about the friction point, wrong about the intervention, or that the friction point is less impactful on conversion than estimated. This information updates the prioritised list and improves the quality of the next hypothesis. A programme that learns from failed tests outperforms one that only analyses wins, because the diagnostic becomes progressively more accurate over time.
